
1 Introduction
2 GWAS Catalog with a ChIP-Seq Experiment
Here, we are gonna analyze the relation between transcription factor binding (ESRRA binding data) from a ChIP-Seq experiment and the genome-wide associations between DNA variants and phenotypes like diseases. For this task, we are gonna use a the gwascat package distributed by the EMBL (European Molecular Biology Laboratories).
First, we need to download the data, keep the 24 chromosomes (from 1 to Y) and, specify the sequence information from the GRCh38 human genome annotation.
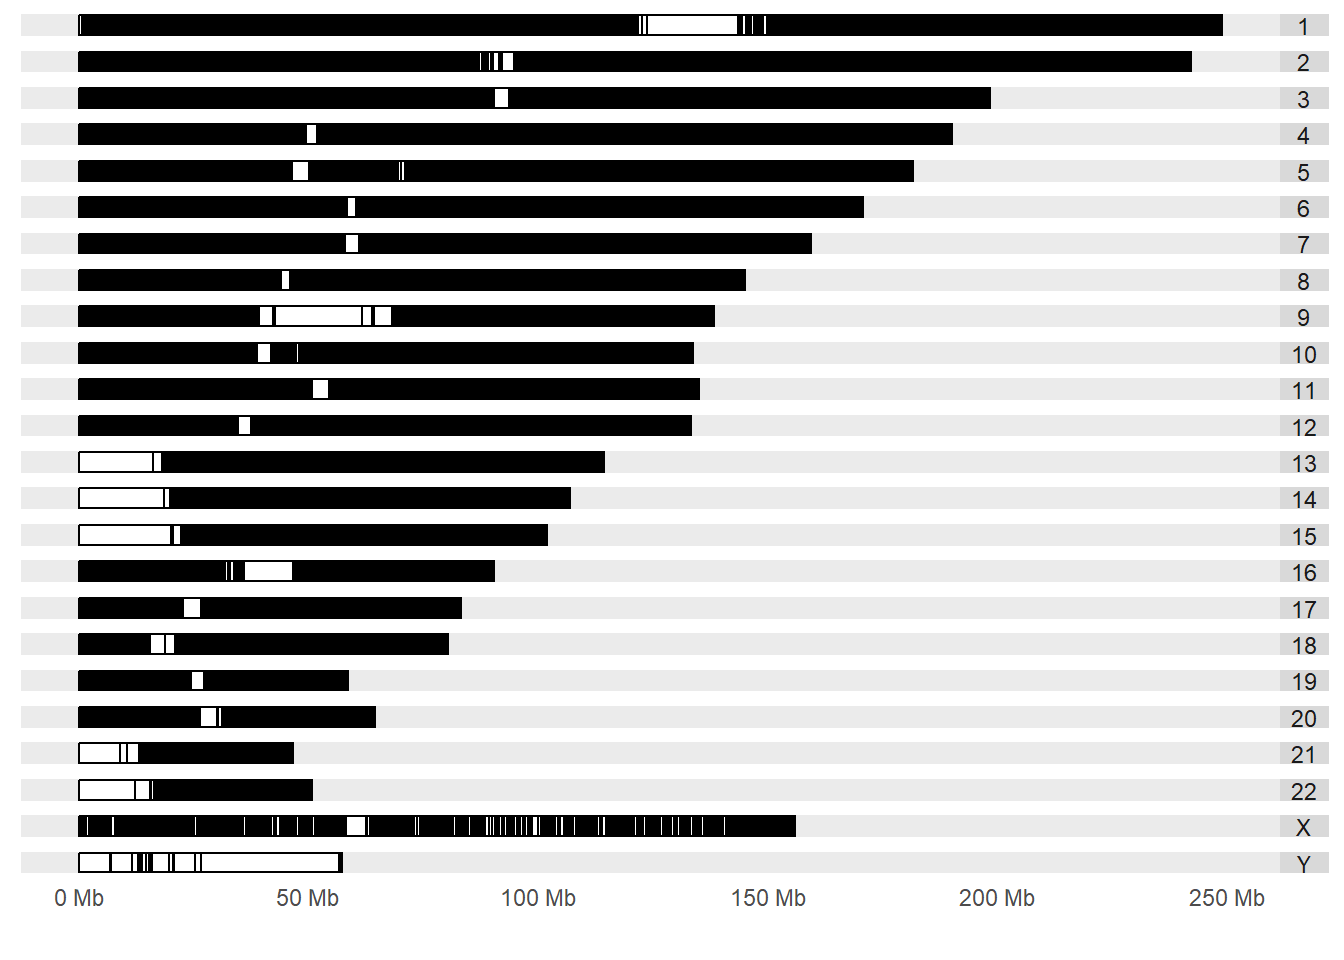
Now, let’s plot a karyogram that will show the SNP’s identified with significant associations with a phenotype. The SNP’s in the GWAS catalog have a stringent criterion of significance and there has been a replication of the finding from a independent population.
We can see the peak data as a GRanges object:
GRanges object with 1873 ranges and 7 metadata columns:
         seqnames            ranges strand |      name     score       col
            <Rle>         <IRanges>  <Rle> | <numeric> <integer> <logical>
     [1]     chrX   1509355-1512462      * |         5         0      <NA>
     [2]     chrX 26801422-26802448      * |         6         0      <NA>
     [3]    chr19 11694102-11695359      * |         1         0      <NA>
     [4]    chr19   4076893-4079276      * |         4         0      <NA>
     [5]     chr3 53288568-53290767      * |         9         0      <NA>
     ...      ...               ...    ... .       ...       ...       ...
  [1869]    chr19 11201120-11203985      * |      8701         0      <NA>
  [1870]    chr19   2234920-2237370      * |       990         0      <NA>
  [1871]     chr1 94311336-94313543      * |      4035         0      <NA>
  [1872]    chr19 45690614-45691210      * |     10688         0      <NA>
  [1873]    chr19   6110100-6111252      * |      2274         0      <NA>
         signalValue    pValue    qValue      peak
           <numeric> <numeric> <numeric> <integer>
     [1]      157.92   310.000        32      1991
     [2]      147.38   310.000        32       387
     [3]       99.71   311.660        32       861
     [4]       84.74   310.000        32      1508
     [5]       78.20   299.505        32      1772
     ...         ...       ...       ...       ...
  [1869]        8.65     7.281   0.26576      2496
  [1870]        8.65    26.258   1.99568      1478
  [1871]        8.65    12.511   1.47237      1848
  [1872]        8.65     6.205   0.00000       298
  [1873]        8.65    17.356   2.01323       496
  -------
  seqinfo: 93 sequences (1 circular) from hg19 genome
If we see the bottom of the GRanges table, this experiment have the hg19 annotation from the human genome. To work on the GRCh38 annotation we need to lift-over with a .chain file. For this we can use the AnnotationHub package.
AnnotationHub with 1 record
# snapshotDate(): 2023-10-23
# names(): AH14150
# $dataprovider: UCSC
# $species: Homo sapiens
# $rdataclass: ChainFile
# $rdatadateadded: 2014-12-15
# $title: hg19ToHg38.over.chain.gz
# $description: UCSC liftOver chain file from hg19 to hg38
# $taxonomyid: 9606
# $genome: hg19
# $sourcetype: Chain
# $sourceurl: http://hgdownload.cse.ucsc.edu/goldenpath/hg19/liftOver/hg19To...
# $sourcesize: NA
# $tags: c("liftOver", "chain", "UCSC", "genome", "homology")
# retrieve record with 'object[["AH14150"]]'
We can find overlaps between the GWAS catalog and the ESRRA ChIP-Seq experiment but, there is a problem; the GWAS catalog is a collection of intervals that reports all significant SNPs and there can be duplications of SNPs associated to multiple phenotypes or the same SNP might be found for the same phenotype in different studies.
We can see the duplications with the reduce function from IRanges package:
[1] 261160We can see that there are 261160 duplicated loci. Let’s find the overlap between the reduced catalog and the ChIP-Seq experiment:
Hits object with 613 hits and 0 metadata columns:
        queryHits subjectHits
        <integer>   <integer>
    [1]         6      237757
    [2]         9      221130
    [3]        12       25060
    [4]        15      104699
    [5]        15      104700
    ...       ...         ...
  [609]      1928      246305
  [610]      1929      244698
  [611]      1929      244699
  [612]      1931      250380
  [613]      1931      250381
  -------
  queryLength: 1932 / subjectLength: 268560
We can see 613 hits. Then, we are gonna eobtain the ranges from those hits, retrieve the phenotypes (DISEASE/TRAIT) and show the top 20 most common phenotypes with association to SNPs that lies on the ESRRA binding peaks.
Distinct phenotypes identified on the peaks:
[1] 613Now, how to do the inference of these phenotype on peaks of these b cells? We can use permutation on the genomic positions to test if the number of phenotypes found is due to chance or not.
[1] 03 Explore the TCGA
Please check the dedicated script (top left) to see how to explore and get insights from the TCGA (The Cancer Genome Atlas) database.
4 Conclusion
References
Citation
BibTeX citation:
@online{palacios_bernuy2024,
  author = {Palacios Bernuy, Piero},
  title = {Integrative {Analysis} of {Multi-omic} {Data}},
  date = {2024-05-01},
  langid = {en},
  abstract = {This document is part of a series of the analysis of Omics
    data. Especifically, here is showed how to analyze bulk RNA-Seq data
    with Bioconductor packages. Also, it’s showcased how to make plots
    of the RNA data in the context of differentially gene expression and
    gene-sets.}
}
For attribution, please cite this work as:
Palacios Bernuy, Piero. 2024. “Integrative Analysis of Multi-Omic
Data.” An Open Source Portfolio. May 1, 2024.