Warning: package 'ggplot2' was built under R version 4.3.2
Warning: package 'tidyr' was built under R version 4.3.2
Warning: package 'readr' was built under R version 4.3.2
Warning: package 'purrr' was built under R version 4.3.2
Warning: package 'dplyr' was built under R version 4.3.2
Warning: package 'stringr' was built under R version 4.3.2
Warning: package 'lubridate' was built under R version 4.3.2
── Attaching core tidyverse packages ──────────────────────── tidyverse 2.0.0 ──
✔ dplyr     1.1.4     ✔ readr     2.1.5
✔ forcats   1.0.0     ✔ stringr   1.5.1
✔ ggplot2   3.5.0     ✔ tibble    3.2.1
✔ lubridate 1.9.3     ✔ tidyr     1.3.1
✔ purrr     1.0.2
── Conflicts ────────────────────────────────────────── tidyverse_conflicts() ──
✖ dplyr::filter() masks stats::filter()
✖ dplyr::lag()    masks stats::lag()
ℹ Use the conflicted package (<http://conflicted.r-lib.org/>) to force all conflicts to become errors
theme_set(theme_minimal())
Introduction
The Cancer Genome Atlas (TCGA) is a massive cancer genomics project compiling high-throughput multi-omic data on dozens of cancer types for public access.
We are gonna use the curatedTCGAData package to manipulate locally to multiple high-throughput datasets from the project. The package provides access to TCGA data that has been curated and stored as a MultiAssayExperiment object on the Bioconductor ExperimentHub.
First, let’s load the packages needed.
In [2]:
library(curatedTCGAData)
Loading required package: MultiAssayExperiment
Warning: package 'MultiAssayExperiment' was built under R version 4.3.1
Loading required package: SummarizedExperiment
Warning: package 'SummarizedExperiment' was built under R version 4.3.1
Loading required package: MatrixGenerics
Warning: package 'MatrixGenerics' was built under R version 4.3.1
Loading required package: matrixStats
Warning: package 'matrixStats' was built under R version 4.3.2
Attaching package: 'matrixStats'
The following object is masked from 'package:dplyr':

    count
The following objects are masked from 'package:lubridate':

    second, second<-
The following objects are masked from 'package:dplyr':

    first, rename
The following object is masked from 'package:tidyr':

    expand
The following object is masked from 'package:utils':

    findMatches
The following objects are masked from 'package:base':

    expand.grid, I, unname
Loading required package: IRanges
Attaching package: 'IRanges'
The following object is masked from 'package:lubridate':

    %within%
The following objects are masked from 'package:dplyr':

    collapse, desc, slice
The following object is masked from 'package:purrr':

    reduce
The following object is masked from 'package:grDevices':

    windows
Loading required package: GenomeInfoDb
Warning: package 'GenomeInfoDb' was built under R version 4.3.2
Loading required package: Biobase
Welcome to Bioconductor

    Vignettes contain introductory material; view with
    'browseVignettes()'. To cite Bioconductor, see
    'citation("Biobase")', and for packages 'citation("pkgname")'.
Attaching package: 'Biobase'
The following object is masked from 'package:MatrixGenerics':

    rowMedians
The following objects are masked from 'package:matrixStats':

    anyMissing, rowMedians
library(TCGAutils)
Warning: package 'TCGAutils' was built under R version 4.3.2
library(MultiAssayExperiment)
Download the Data
To download the data we need to use curatedTCGADatafunction. The first argument is a four letter disease (cancer) code (A complete list of disease codes used by the TCGA project are available on the NCI Genomic Data Commons website), the second argument is a vector of data types we want to download. We need to specify dry.run = FALSE to download the data.
In this specific case, we are gonna work with RNA-Seq data, mutation data and methylation data from Rectum Adenocarcinoma (READ). The clinical data is included by default.
In [3]:
readData =curatedTCGAData("READ", c("RNASeq2GeneNorm", "Mutation", "Methylation_methyl450"), dry.run =FALSE, version ="2.1.1")
Working on: READ_Mutation-20160128
see ?curatedTCGAData and browseVignettes('curatedTCGAData') for documentation
loading from cache
require("RaggedExperiment")
Warning: package 'RaggedExperiment' was built under R version 4.3.1
Working on: READ_RNASeq2GeneNorm-20160128
see ?curatedTCGAData and browseVignettes('curatedTCGAData') for documentation
loading from cache
Working on: READ_Methylation_methyl450-20160128
see ?curatedTCGAData and browseVignettes('curatedTCGAData') for documentation
loading from cache
require("rhdf5")
Warning: package 'rhdf5' was built under R version 4.3.2
see ?curatedTCGAData and browseVignettes('curatedTCGAData') for documentation
loading from cache
Loading required package: HDF5Array
Warning: package 'HDF5Array' was built under R version 4.3.2
Loading required package: DelayedArray
Warning: package 'DelayedArray' was built under R version 4.3.1
Loading required package: Matrix
Warning: package 'Matrix' was built under R version 4.3.2
Attaching package: 'Matrix'
The following object is masked from 'package:S4Vectors':

    expand
The following objects are masked from 'package:tidyr':

    expand, pack, unpack
Loading required package: S4Arrays
Warning: package 'S4Arrays' was built under R version 4.3.2
Loading required package: abind
Attaching package: 'S4Arrays'
The following object is masked from 'package:abind':

    abind
The following object is masked from 'package:base':

    rowsum
Loading required package: SparseArray
Warning: package 'SparseArray' was built under R version 4.3.2
Attaching package: 'DelayedArray'
The following object is masked from 'package:purrr':

    simplify
The following objects are masked from 'package:base':

    apply, scale, sweep
Attaching package: 'HDF5Array'
The following object is masked from 'package:rhdf5':

    h5ls
Working on: READ_colData-20160128
see ?curatedTCGAData and browseVignettes('curatedTCGAData') for documentation
loading from cache
Working on: READ_sampleMap-20160128
see ?curatedTCGAData and browseVignettes('curatedTCGAData') for documentation
loading from cache
Working on: READ_metadata-20160128
see ?curatedTCGAData and browseVignettes('curatedTCGAData') for documentation
loading from cache
harmonizing input:
  removing 1903 sampleMap rows not in names(experiments)
  removing 2 colData rownames not in sampleMap 'primary'
readData # this is a MultiAssayExperiment object
A MultiAssayExperiment object of 3 listed
 experiments with user-defined names and respective classes.
 Containing an ExperimentList class object of length 3:
 [1] READ_Mutation-20160128: RaggedExperiment with 22075 rows and 69 columns
 [2] READ_RNASeq2GeneNorm-20160128: SummarizedExperiment with 18115 rows and 177 columns
 [3] READ_Methylation_methyl450-20160128: SummarizedExperiment with 485577 rows and 106 columns
Functionality:
 experiments() - obtain the ExperimentList instance
 colData() - the primary/phenotype DataFrame
 sampleMap() - the sample coordination DataFrame
 `$`, `[`, `[[` - extract colData columns, subset, or experiment
 *Format() - convert into a long or wide DataFrame
 assays() - convert ExperimentList to a SimpleList of matrices
 exportClass() - save data to flat files
Review the Clinical Metadata
We can see which patients have data for each assay. The assay column gives the experiment type, the primary column gives the unique patient ID and the colname gives the sample ID used as a identifier within a given experiment.
Not all patients have data for all assays, and some of them can have multiple data entries for one or more experiment type. This may correspond to multiple biopsies or matched tumor and normal samples from an individual patient.
Is important to note that the data stored in assay(mut_data) is difficult to work with because is a sparse matrix that has a row for each GRanges with a mutation in at least one sample.
In [14]:
assay(mut_data)[1:3,1:3]
                      TCGA-AF-2689-01A-01W-0831-10 TCGA-AF-2691-01A-01W-0831-10
X:54241715-54241716:+ "WNK3"                       NA
7:111899511:+         "IFRD1"                      NA
7:113309556:+         "PPP1R3A"                    NA
                      TCGA-AF-2692-01A-01W-0831-10
X:54241715-54241716:+ NA
7:111899511:+         NA
7:113309556:+         NA
# Is a sparse matrixassay(mut_data)[1,] |>table(useNA="ifany")
WNK3 <NA>
   1   68
We can get more information if we look at the mutation information for each patient.
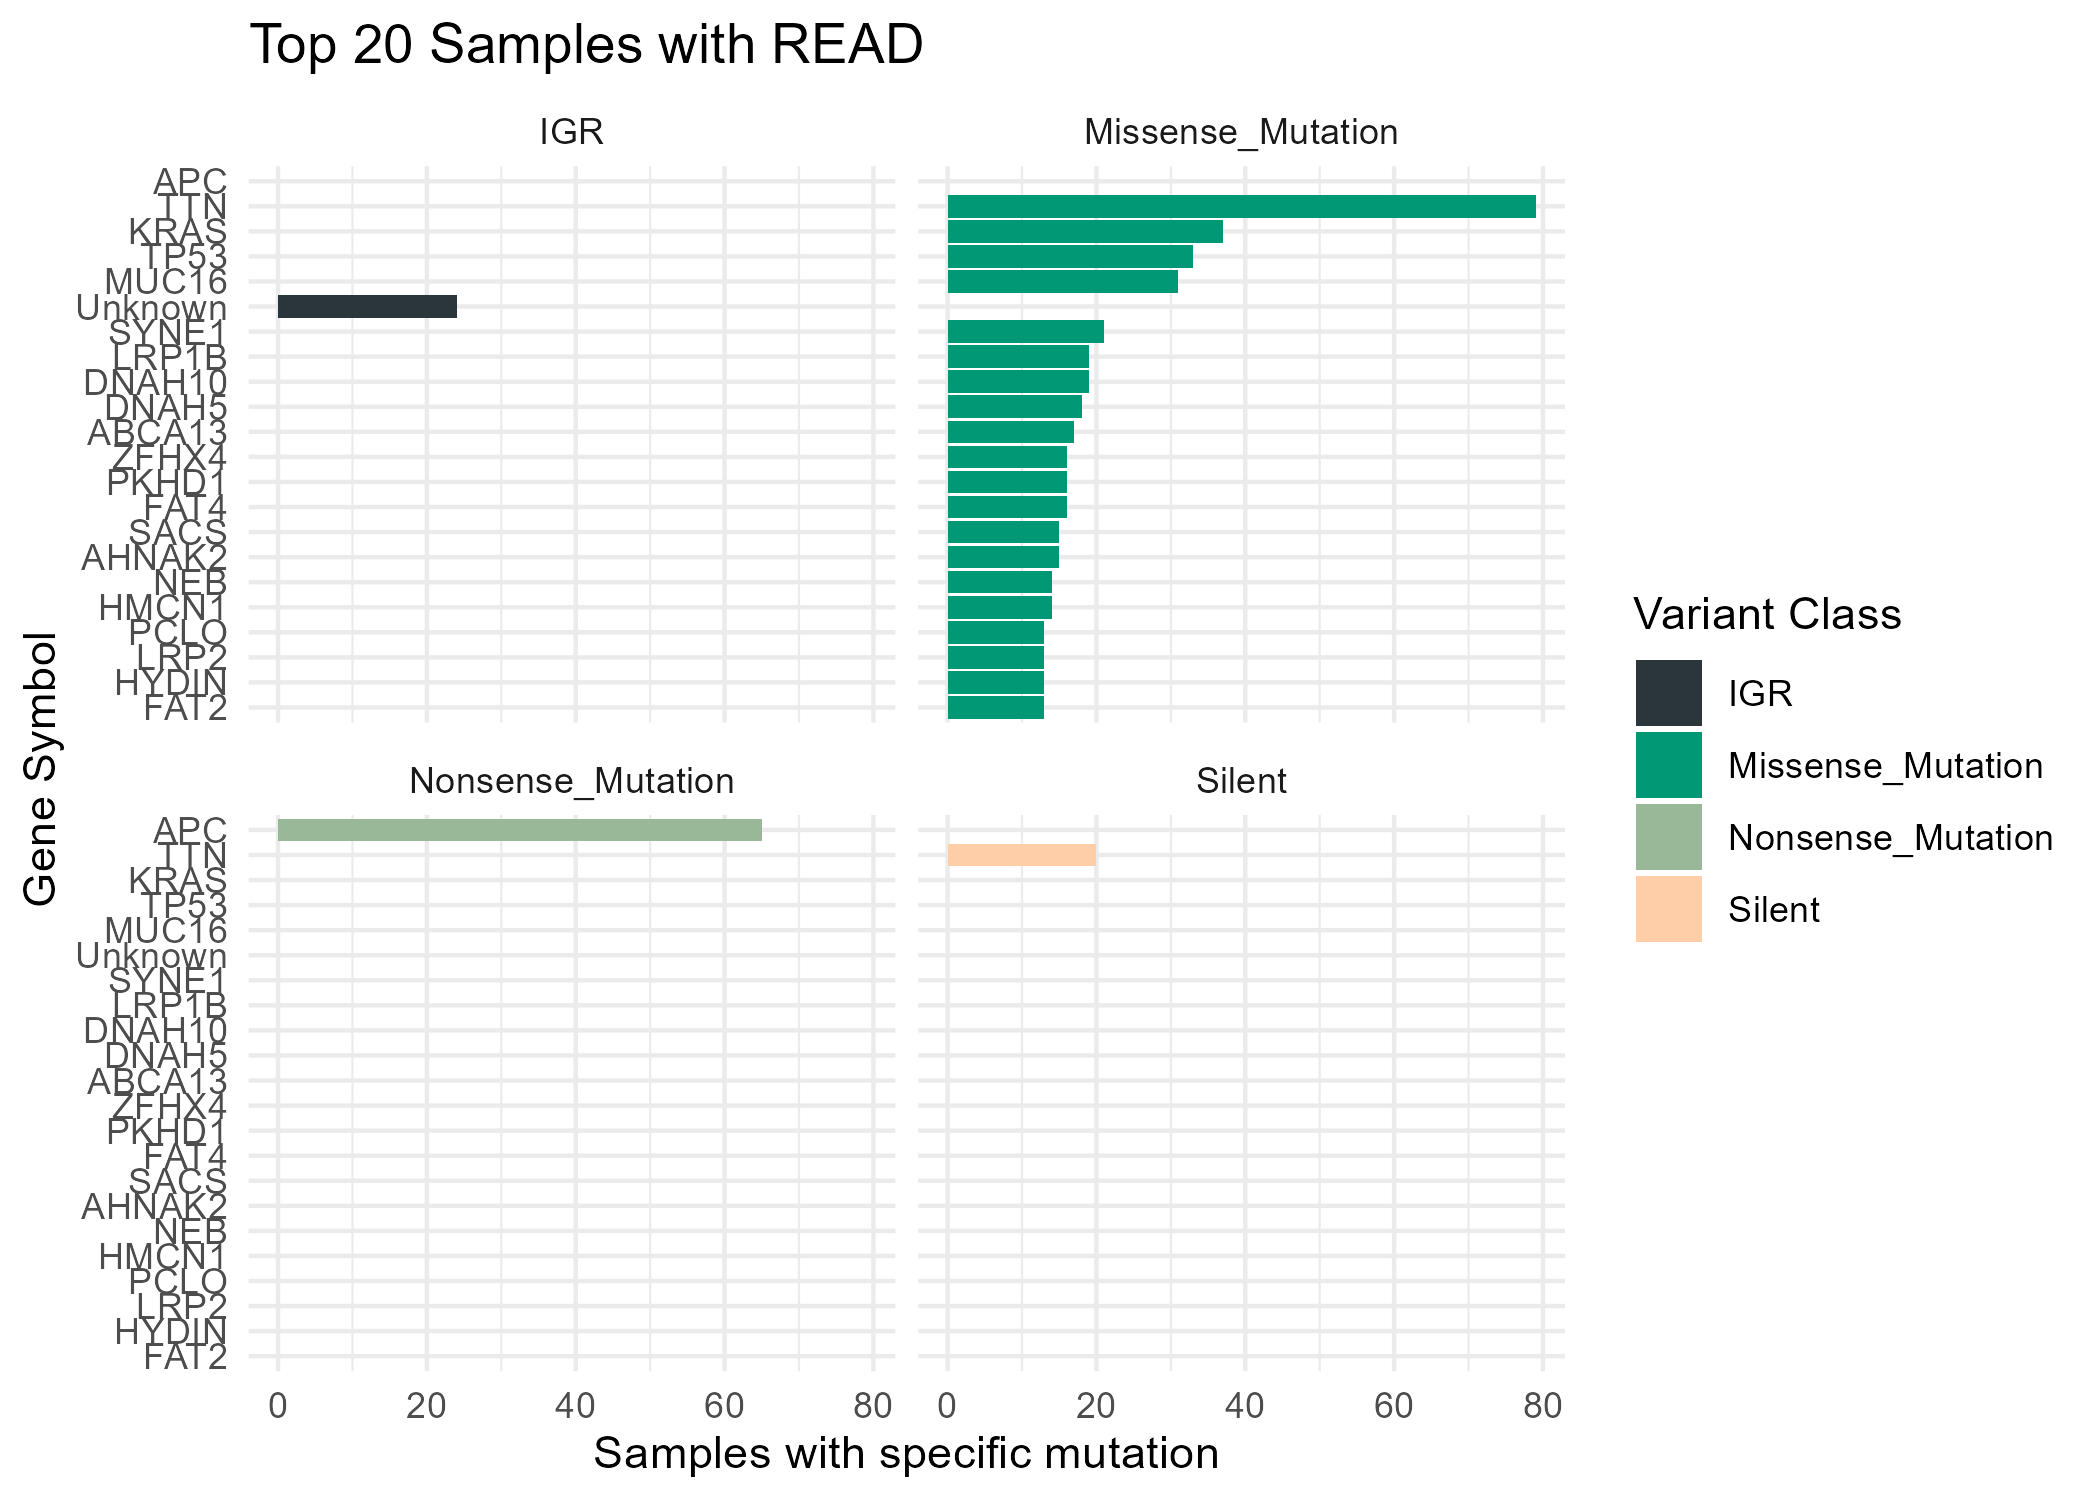
Let’s inspect the data from the first patient. We can see from the metadata information the Hugo Symbol, mutation status and predicted effect of each mutation at variant classification.
In [16]:
mut_assay[[1]]
GRanges object with 64 ranges and 34 metadata columns:
seqnames ranges strand | Hugo_Symbol Entrez_Gene_Id
<Rle> <IRanges> <Rle> | <character> <character>
[1] X 54241715-54241716 + | WNK3 65267
[2] 7 111899511 + | IFRD1 3475
[3] 7 113309556 + | PPP1R3A 5506
[4] 7 128146325 + | FAM71F1 84691
[5] 7 156447624 + | NOM1 64434
... ... ... ... . ... ...
[60] 10 50616059 + | OGDHL 55753
[61] 10 96343335 + | HELLS 3070
[62] 5 139173166 + | PSD2 84249
[63] 5 147800932 + | FBXO38 81545
[64] 5 54365356 + | GZMK 3003
Center NCBI_Build Variant_Classification Variant_Type
<character> <character> <character> <character>
[1] hgsc.bcm.edu 36 Frame_Shift_Ins INS
[2] hgsc.bcm.edu 36 Missense_Mutation SNP
[3] hgsc.bcm.edu 36 Missense_Mutation SNP
[4] hgsc.bcm.edu 36 Silent SNP
[5] hgsc.bcm.edu 36 Missense_Mutation SNP
... ... ... ... ...
[60] hgsc.bcm.edu 36 Silent SNP
[61] hgsc.bcm.edu 36 Silent SNP
[62] hgsc.bcm.edu 36 Nonsense_Mutation SNP
[63] hgsc.bcm.edu 36 Silent SNP
[64] hgsc.bcm.edu 36 Missense_Mutation SNP
Reference_Allele Tumor_Seq_Allele1 Tumor_Seq_Allele2 dbSNP_RS
<character> <character> <character> <character>
[1] - - T novel
[2] A A G novel
[3] T T C novel
[4] G G A novel
[5] A A G novel
... ... ... ... ...
[60] G G A novel
[61] T T C novel
[62] C C T novel
[63] G G A novel
[64] T T A novel
dbSNP_Val_Status Matched_Norm_Sample_Barcode Match_Norm_Seq_Allele1
<character> <character> <character>
[1] unknown TCGA-AF-2689-10A-01W.. -
[2] unknown TCGA-AF-2689-10A-01W.. A
[3] unknown TCGA-AF-2689-10A-01W.. T
[4] unknown TCGA-AF-2689-10A-01W.. G
[5] unknown TCGA-AF-2689-10A-01W.. A
... ... ... ...
[60] unknown TCGA-AF-2689-10A-01W.. G
[61] unknown TCGA-AF-2689-10A-01W.. T
[62] unknown TCGA-AF-2689-10A-01W.. C
[63] unknown TCGA-AF-2689-10A-01W.. G
[64] unknown TCGA-AF-2689-10A-01W.. T
Match_Norm_Seq_Allele2 Tumor_Validation_Allele1 Tumor_Validation_Allele2
<character> <character> <character>
[1] - - T
[2] A A G
[3] T T C
[4] G . .
[5] A A G
... ... ... ...
[60] G . .
[61] T . .
[62] C C T
[63] G G A
[64] T T A
Match_Norm_Validation_Allele1 Match_Norm_Validation_Allele2
<character> <character>
[1] - -
[2] A A
[3] T T
[4] . .
[5] A A
... ... ...
[60] . .
[61] . .
[62] C C
[63] G G
[64] T T
Verification_Status Validation_Status Mutation_Status Sequencing_Phase
<character> <character> <character> <character>
[1] Unknown Valid Somatic Phase_I
[2] Unknown Valid Somatic Phase_I
[3] Unknown Valid Somatic Phase_I
[4] Unknown Unknown Somatic Phase_I
[5] Unknown Valid Somatic Phase_I
... ... ... ... ...
[60] Unknown Unknown Somatic Phase_I
[61] Unknown Unknown Somatic Phase_I
[62] Unknown Valid Somatic Phase_I
[63] Unknown Valid Somatic Phase_I
[64] Unknown Valid Somatic Phase_I
Sequence_Source Validation_Method Score BAM_file Sequencer
<character> <character> <character> <character> <character>
[1] Capture 454 SOLID
[2] Capture 454 SOLID
[3] Capture 454 SOLID
[4] Capture . SOLID
[5] Capture 454 SOLID
... ... ... ... ... ...
[60] Capture . SOLID
[61] Capture . SOLID
[62] Capture 454 SOLID
[63] Capture 454 SOLID
[64] Capture 454 SOLID
TranscriptID Exon ChromChange AAChange COSMIC_Codon
<character> <character> <character> <character> <character>
[1] NM_001002838 exon23 c.4999_5000insA p.L1667fs .
[2] NM_001550 exon10 c.A1043G p.E348G .
[3] NM_002711 exon2 c.A838G p.T280A .
[4] NM_032599 exon3 c.G639A p.T213T .
[5] NM_138400 exon5 c.A1651G p.T551A .
... ... ... ... ... ...
[60] NM_001143996 exon18 c.C2286T p.S762S .
[61] NM_018063 exon18 c.T2061C p.D687D .
[62] NM_032289 exon3 c.C460T p.Q154X .
[63] NM_205836 exon21 c.G3327A p.R1109R .
[64] NM_002104 exon5 c.T640A p.S214T .
COSMIC_Gene Drug_Target
<character> <character>
[1] . .
[2] . .
[3] . .
[4] . .
[5] . .
... ... ...
[60] . .
[61] . .
[62] . .
[63] . .
[64] . .
-------
seqinfo: 24 sequences from NCBI36 genome; no seqlengths
Now, is kind of a trouble to inspect manually each patient. So, lets get all mutation information from Hugo symbol and Variant classification for all the patients.
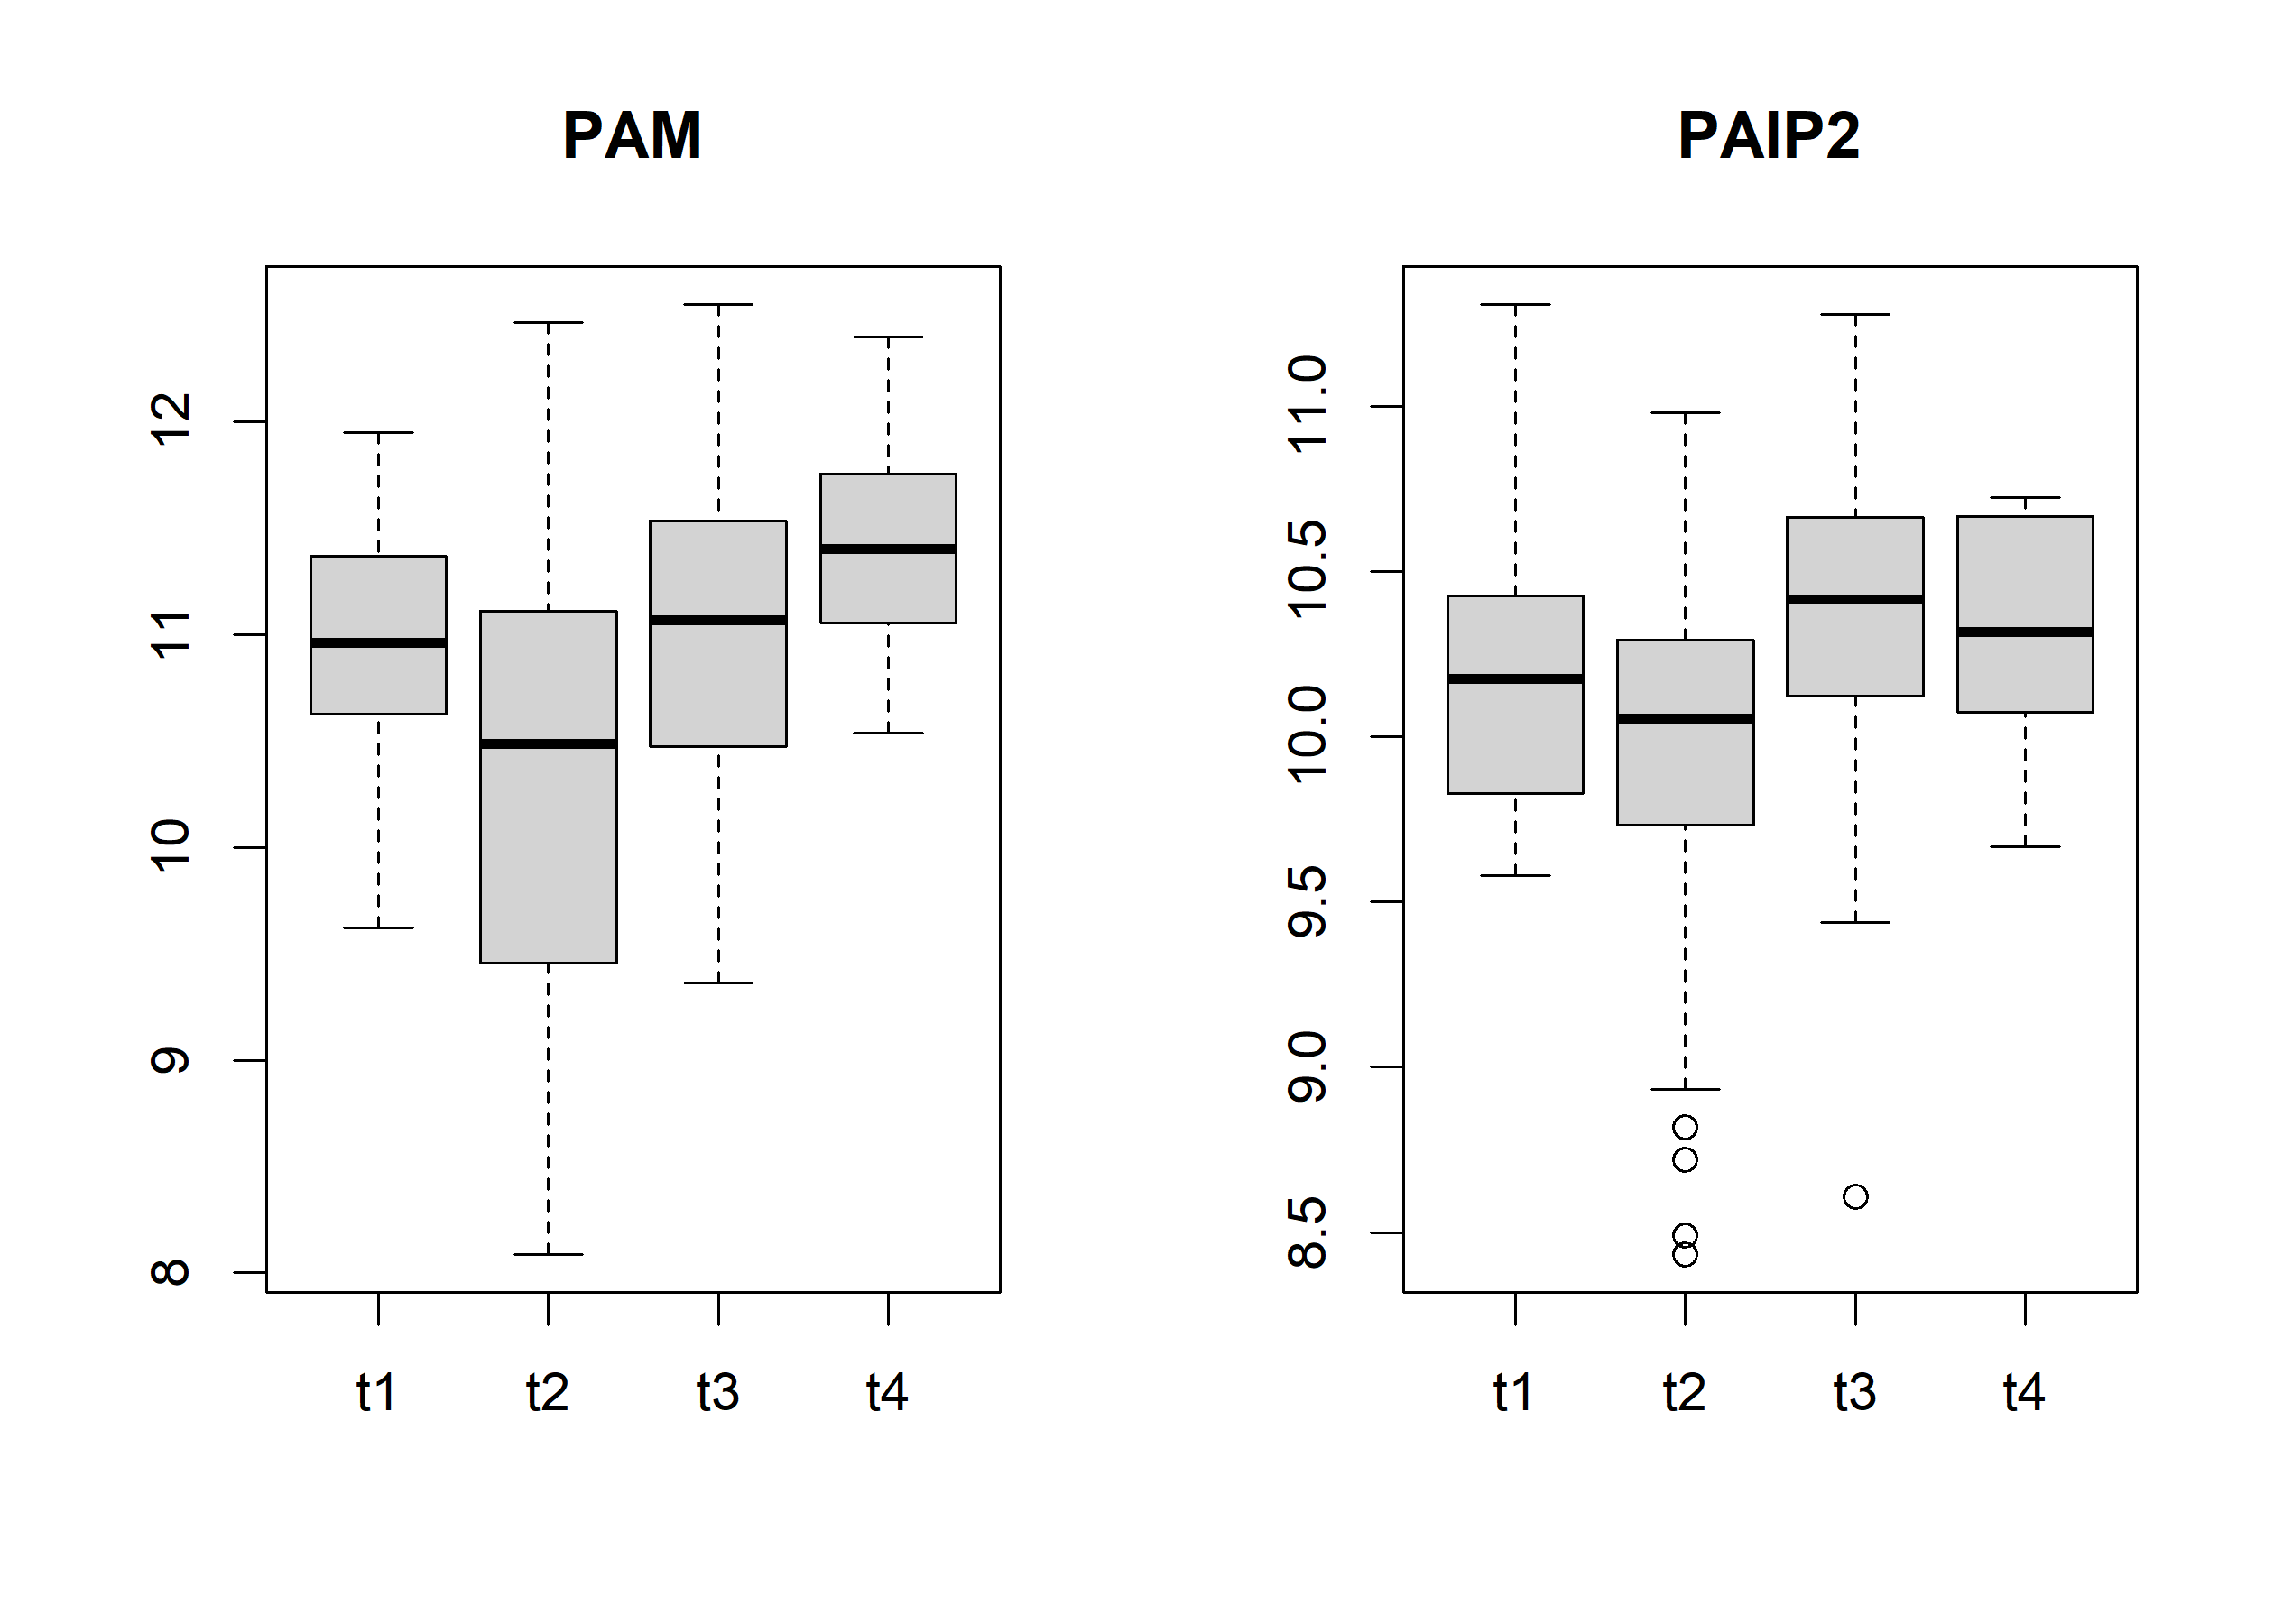
Then, we can use the limma package to proceed with the differential expression analysis. In this case, we’ll ise the tumor stage as a variable to explain the expression of the genes.
In [24]:
library(limma)
Warning: package 'limma' was built under R version 4.3.1
Attaching package: 'limma'
The following object is masked from 'package:BiocGenerics':

    plotMA
mm =model.matrix(~t_stage, data=colData(rnaseq))f1 =lmFit(assay(rnaseq), mm)
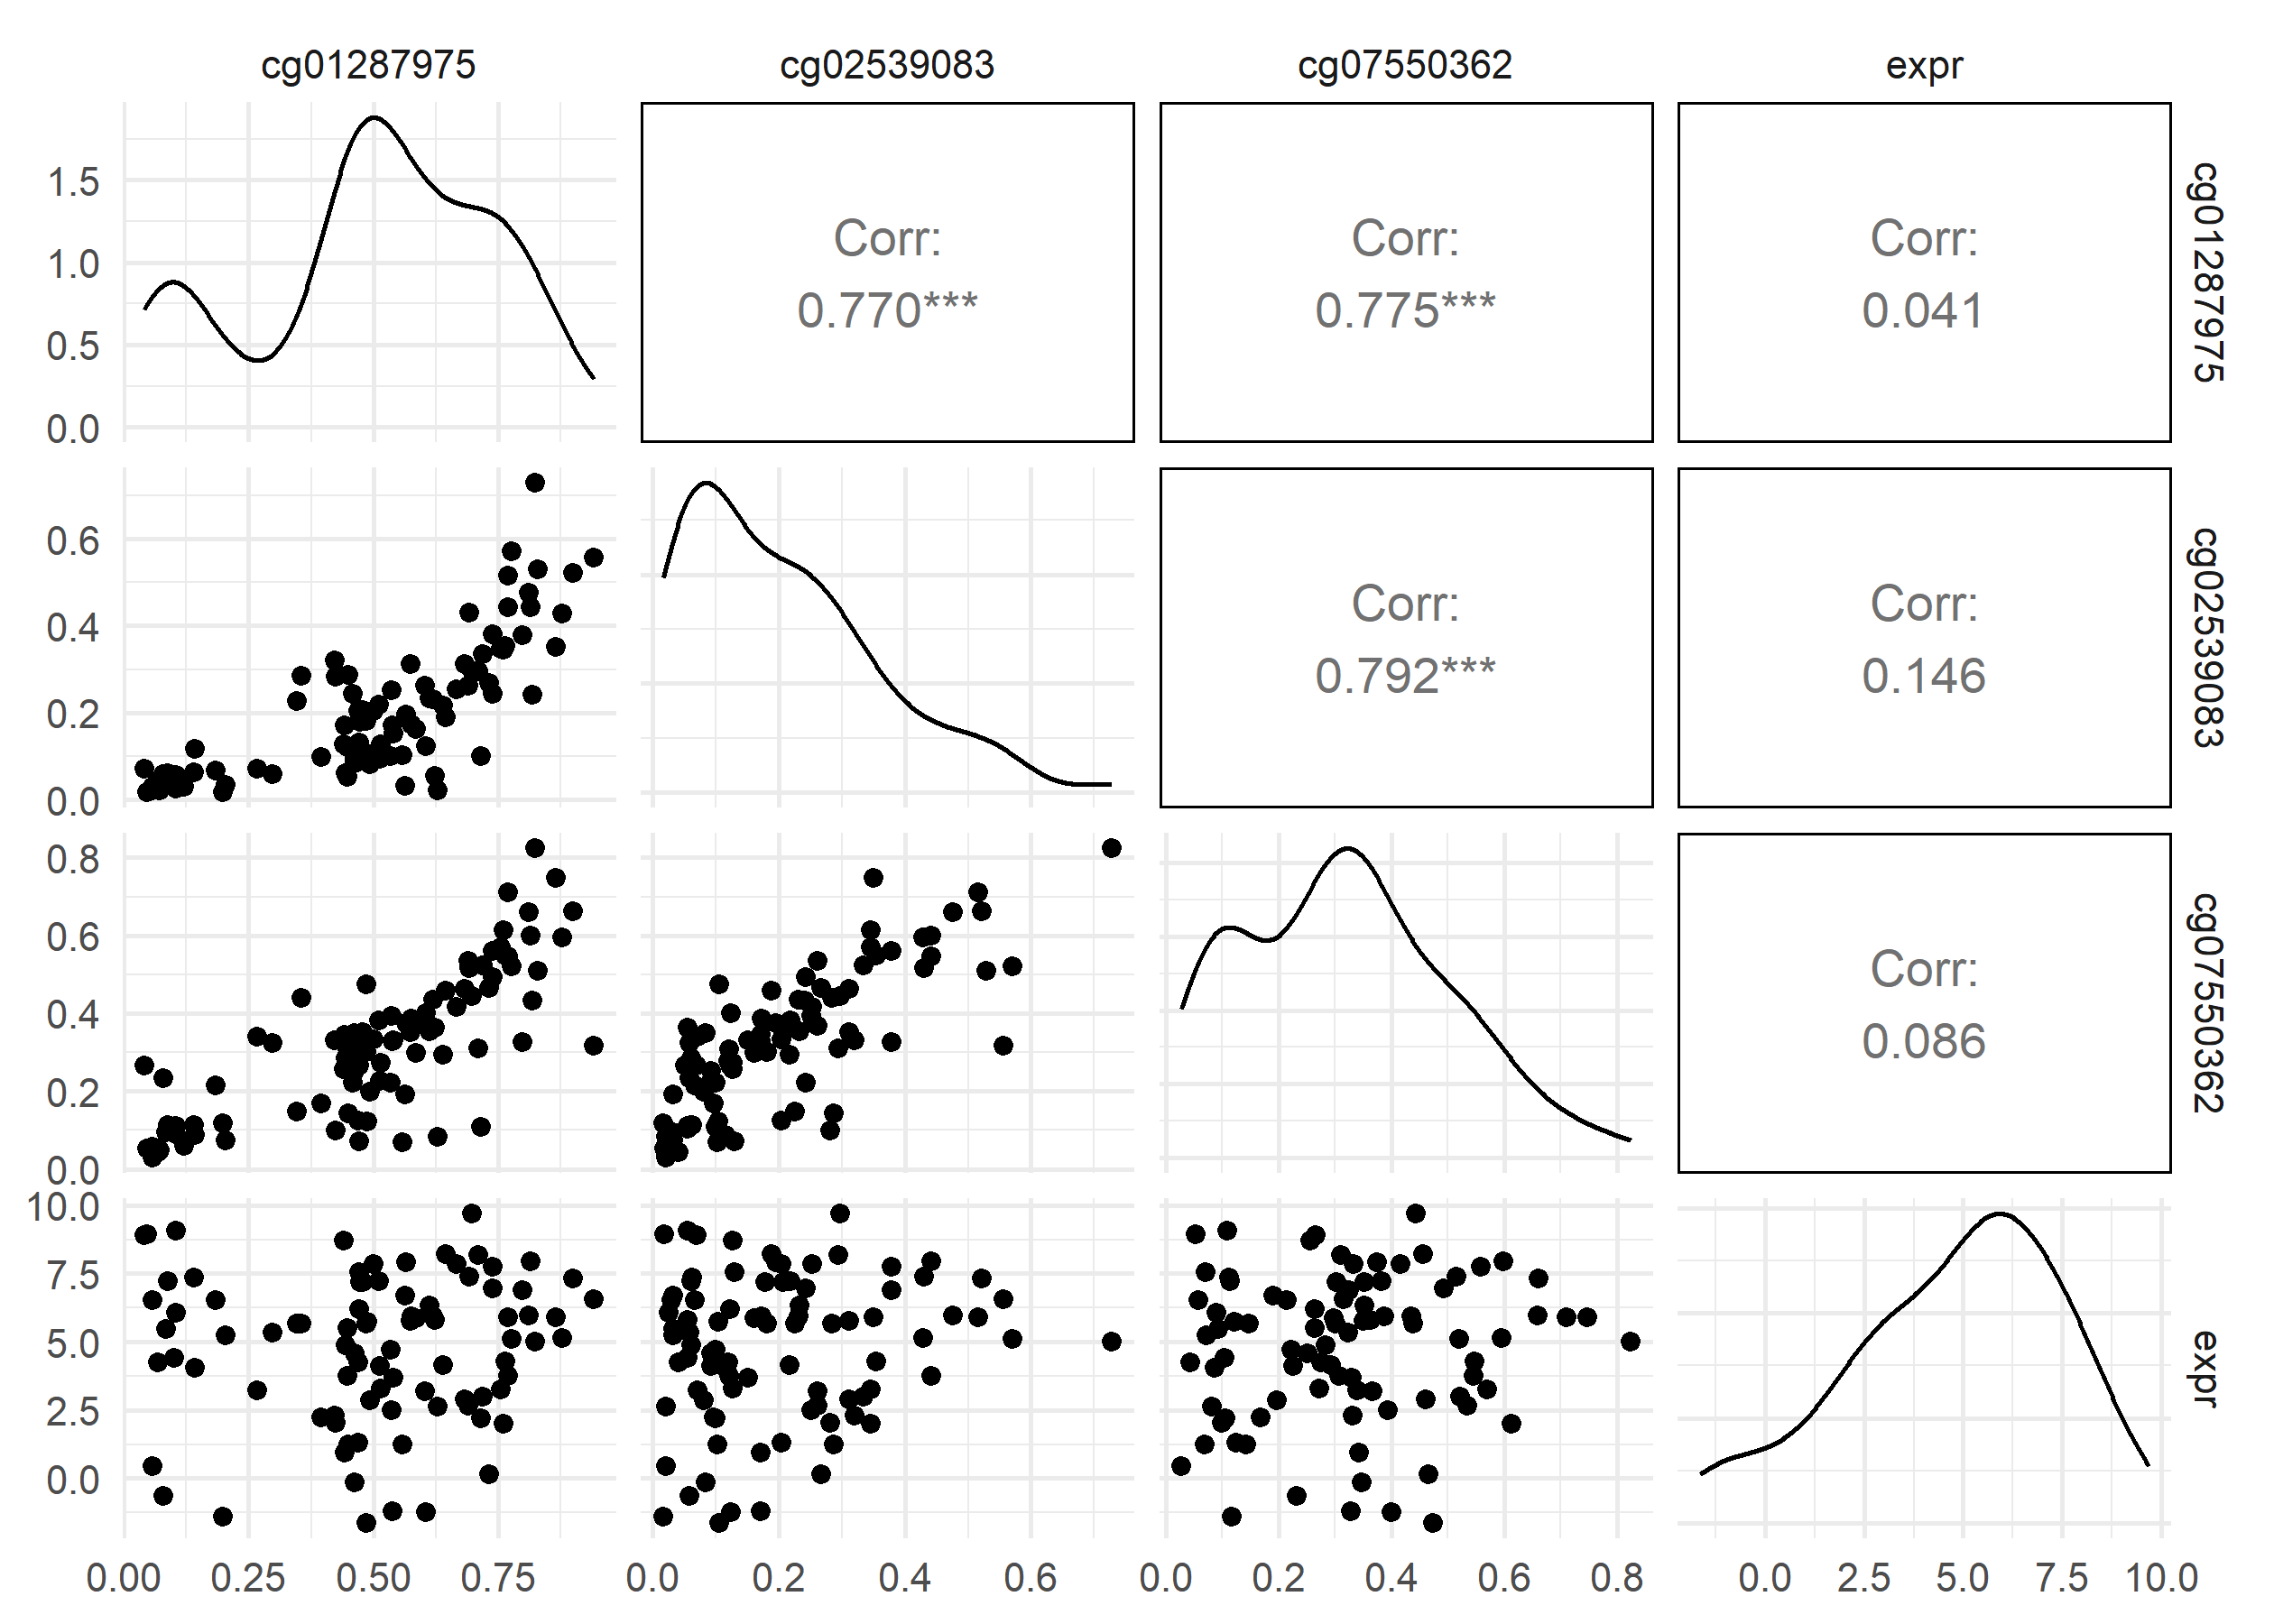
Finally, we can use the methylation data with the expression data. This is important because methylated cytosines of the DNA change the expression of the genes.
Some patients have methylation data for multiples tissue types. This information is encoded in the fourth component of the sample names. The code 01A correspond to primary tumor samples and the code 11A correspond to normal tissue. We’ll keep the primary tumor samples.
DataFrame with 485577 rows and 3 columns
           Gene_Symbol  Chromosome Genomic_Coordinate
           <character> <character>        <character>
cg00000029        RBL2          16           53468112
cg00000108     C3orf35           3           37459206
cg00000109      FNDC3B           3          171916037
cg00000165          NA           1           91194674
cg00000236       VDAC3           8           42263294
...                ...         ...                ...
rs9363764           NA          NA                  0
rs939290            NA          NA                  0
rs951295            NA          NA                  0
rs966367            NA          NA                  0
rs9839873           NA          NA                  0
This function takes a gene symbol and returns a scatter plot showing the relationship between 3 different sites near that gene and gene expression.
In [30]:
me_rna_cor =function(sym, mpick =3){require(GGally)# subset methylation data to first mpick methylation sites for given gene symbol methyl_ind =which(methyl_genes$Gene_Symbol == sym)if (length(methyl_ind) > mpick){ methyl_ind = methyl_ind[1:mpick] } methyl_dat =assay(methyl_subset)[methyl_ind,] # subset to selected methylation sites# subset expression data to selected gene symbol expr_ind =which(rownames(rnaseq_subset) == sym) expr_dat =assay(rnaseq_subset)[expr_ind,]# combine methylation and expression data as data frame combined_dat =as(t(methyl_dat), "DataFrame") combined_dat$expr = expr_dat# plot pairs and calculate correlation coefficients between methylation and expressionggpairs(combined_dat) |>print()sapply(1:mpick, function(i){ cor_to <-as.numeric(combined_dat[,mpick+1]) df <-data.frame(v1=as.numeric(combined_dat[,i]),v2 = cor_to) df <- df |>na.omit()cor(df[,1], df[,2]) })}me_rna_cor("TAC1", mpick=3)
Loading required package: GGally
Warning: package 'GGally' was built under R version 4.3.2
Registered S3 method overwritten by 'GGally':
  method from
  +.gg   ggplot2
Warning: Removed 5 rows containing missing values or values outside the scale range
(`geom_point()`).
Removed 5 rows containing missing values or values outside the scale range
(`geom_point()`).
Removed 5 rows containing missing values or values outside the scale range
(`geom_point()`).
Warning: Removed 5 rows containing non-finite outside the scale range
(`stat_density()`).
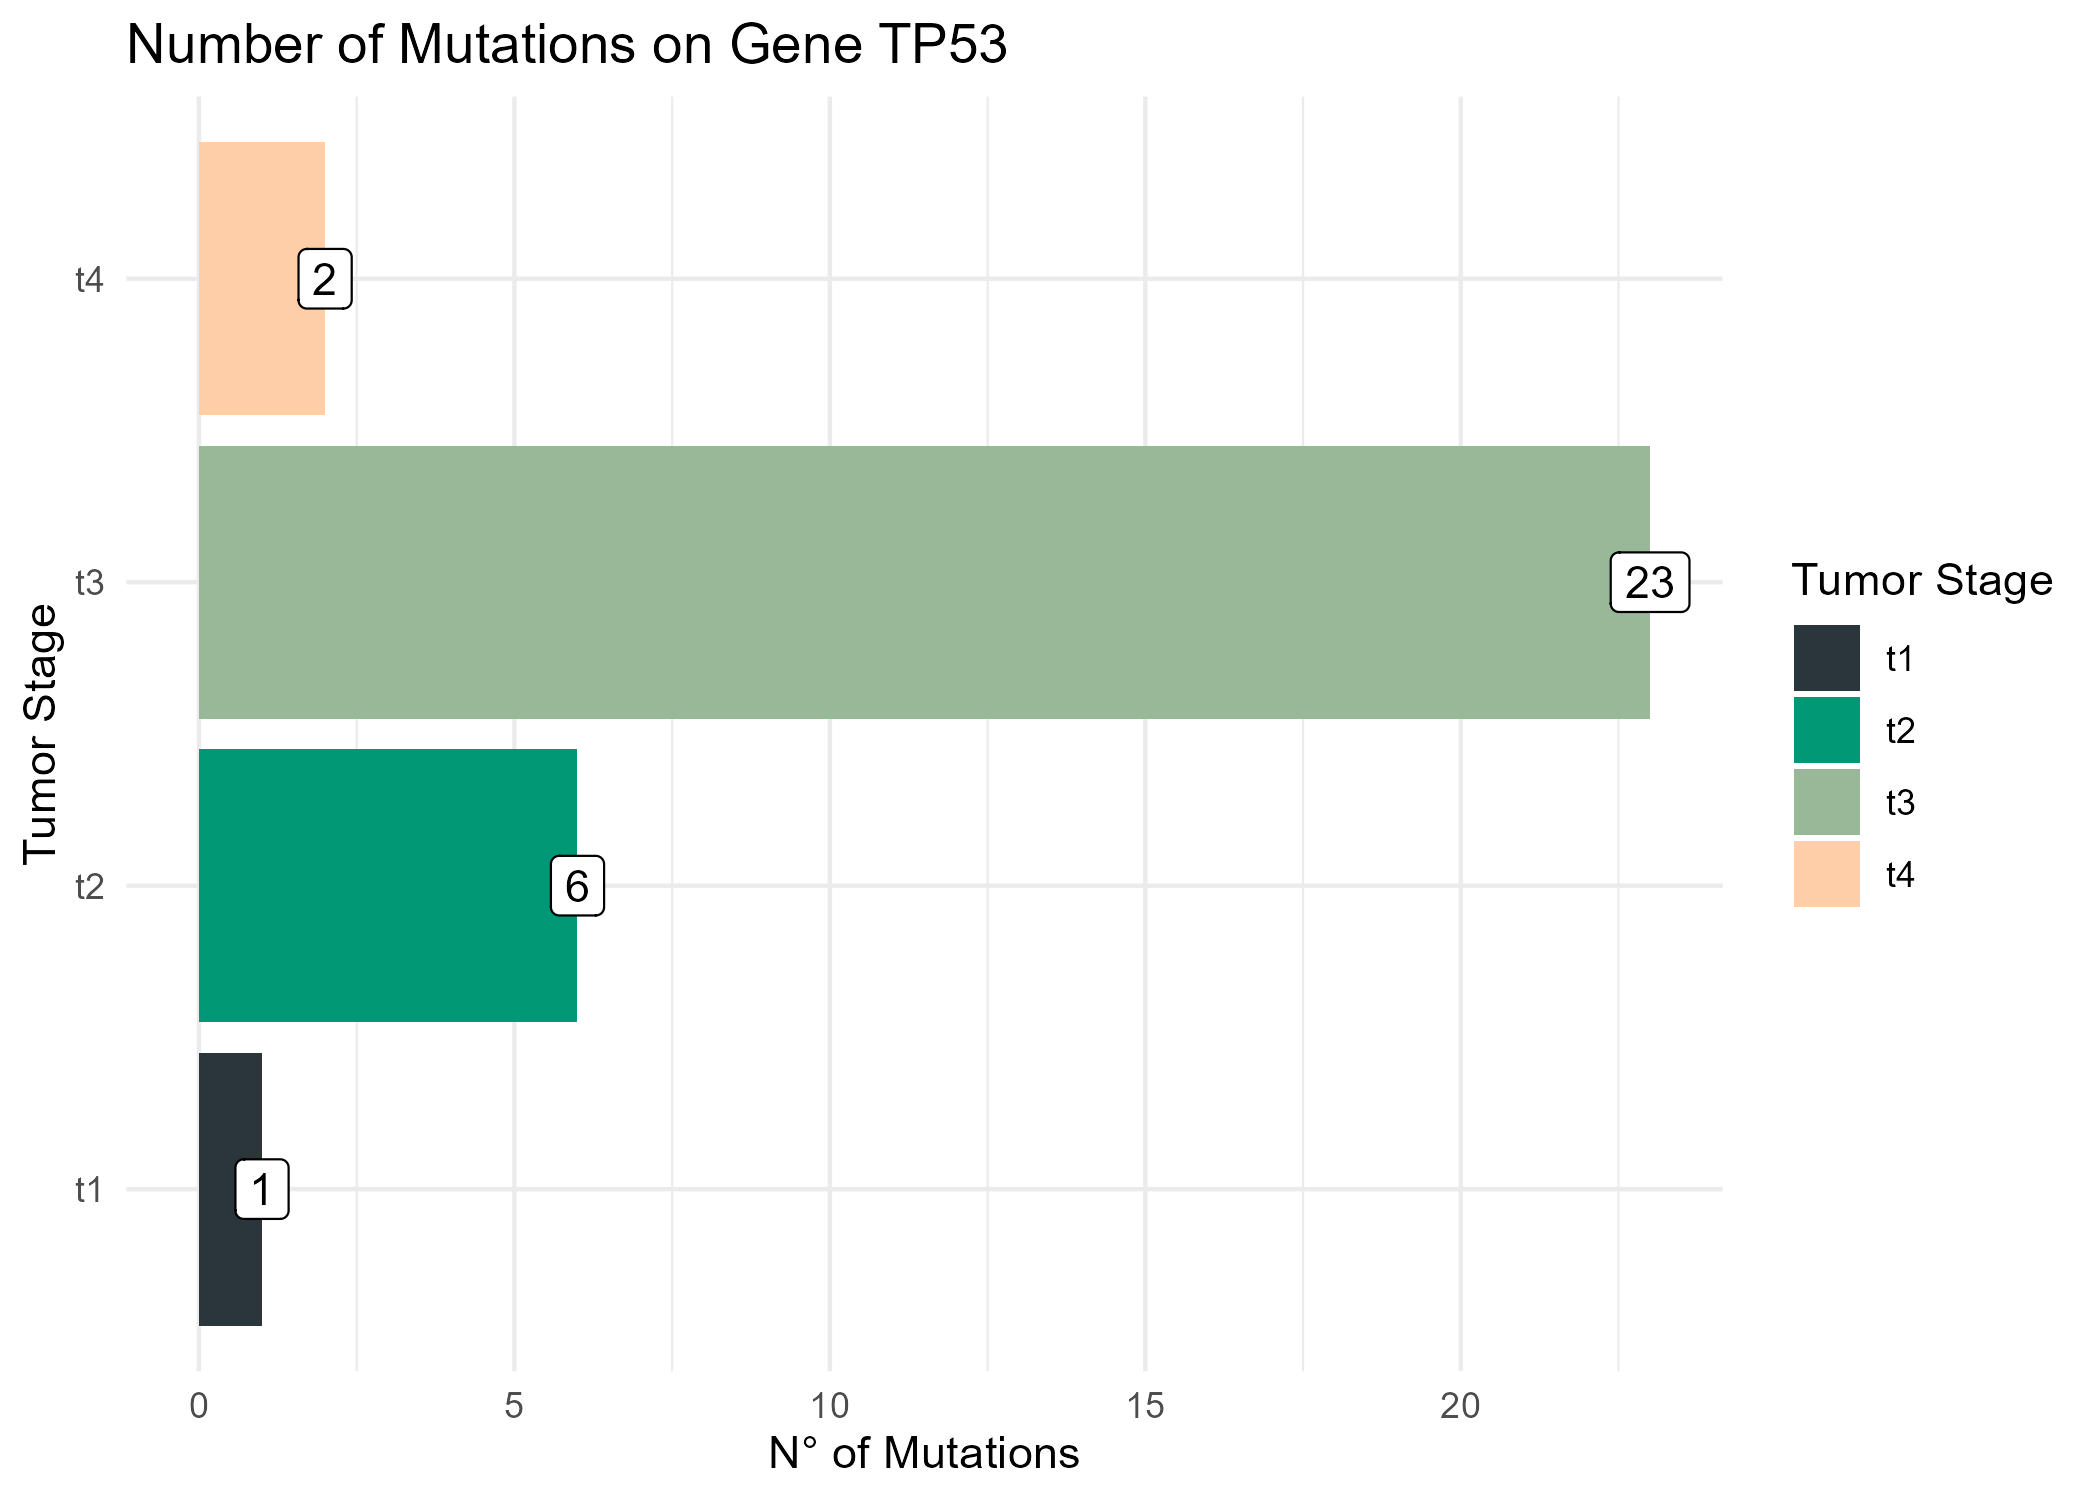
 ## Linking mutations and tumor stage