Back to Article
DNA methylation measurement by sequencing
Download Source

DNA methylation measurement by sequencing

Methyl-Seq

Author

Piero Palacios Bernuy

Whole-genome bisulfite sequencing (WGBS)

In [1]:
Code
library(bsseq)
Warning: package 'bsseq' was built under R version 4.3.1
Loading required package: BiocGenerics

Attaching package: 'BiocGenerics'
The following objects are masked from 'package:stats':

    IQR, mad, sd, var, xtabs
The following objects are masked from 'package:base':

    anyDuplicated, aperm, append, as.data.frame, basename, cbind,
    colnames, dirname, do.call, duplicated, eval, evalq, Filter, Find,
    get, grep, grepl, intersect, is.unsorted, lapply, Map, mapply,
    match, mget, order, paste, pmax, pmax.int, pmin, pmin.int,
    Position, rank, rbind, Reduce, rownames, sapply, setdiff, sort,
    table, tapply, union, unique, unsplit, which.max, which.min
Loading required package: GenomicRanges
Loading required package: stats4
Loading required package: S4Vectors

Attaching package: 'S4Vectors'
The following object is masked from 'package:utils':

    findMatches
The following objects are masked from 'package:base':

    expand.grid, I, unname
Loading required package: IRanges

Attaching package: 'IRanges'
The following object is masked from 'package:grDevices':

    windows
Loading required package: GenomeInfoDb
Loading required package: SummarizedExperiment
Warning: package 'SummarizedExperiment' was built under R version 4.3.1
Loading required package: MatrixGenerics
Warning: package 'MatrixGenerics' was built under R version 4.3.1
Loading required package: matrixStats
Warning: package 'matrixStats' was built under R version 4.3.1

Attaching package: 'MatrixGenerics'
The following objects are masked from 'package:matrixStats':

    colAlls, colAnyNAs, colAnys, colAvgsPerRowSet, colCollapse,
    colCounts, colCummaxs, colCummins, colCumprods, colCumsums,
    colDiffs, colIQRDiffs, colIQRs, colLogSumExps, colMadDiffs,
    colMads, colMaxs, colMeans2, colMedians, colMins, colOrderStats,
    colProds, colQuantiles, colRanges, colRanks, colSdDiffs, colSds,
    colSums2, colTabulates, colVarDiffs, colVars, colWeightedMads,
    colWeightedMeans, colWeightedMedians, colWeightedSds,
    colWeightedVars, rowAlls, rowAnyNAs, rowAnys, rowAvgsPerColSet,
    rowCollapse, rowCounts, rowCummaxs, rowCummins, rowCumprods,
    rowCumsums, rowDiffs, rowIQRDiffs, rowIQRs, rowLogSumExps,
    rowMadDiffs, rowMads, rowMaxs, rowMeans2, rowMedians, rowMins,
    rowOrderStats, rowProds, rowQuantiles, rowRanges, rowRanks,
    rowSdDiffs, rowSds, rowSums2, rowTabulates, rowVarDiffs, rowVars,
    rowWeightedMads, rowWeightedMeans, rowWeightedMedians,
    rowWeightedSds, rowWeightedVars
Loading required package: Biobase
Welcome to Bioconductor

    Vignettes contain introductory material; view with
    'browseVignettes()'. To cite Bioconductor, see
    'citation("Biobase")', and for packages 'citation("pkgname")'.

Attaching package: 'Biobase'
The following object is masked from 'package:MatrixGenerics':

    rowMedians
The following objects are masked from 'package:matrixStats':

    anyMissing, rowMedians

The metadata loaded below can be downloaded from SRA from NCBI or from GEO (GSE46644).

In [2]:
Code
targets <- read.table(file.path("targets2.txt"),header = T, sep = "\t")

targets <- DataFrame(targets, row.names = as.character(targets$Run))

# This code is not executed due to limit size (50 mb) of github
# Please load the 450karrar_processed.rds data that is the resulto of this code
# If you want to do this with the original data, you can find this data on: 
# https://github.com/genomicsclass/colonCancerWGBS

path <- paste0(getwd(),"/colonCancerWGBS-master")

targets <- read.table(file.path(path,"targets2.txt"),header = T, sep = "\t")

targets <- DataFrame(targets, row.names = as.character(targets$Run))

covfiles <- file.path(path, paste0(rownames(targets), ".chr22.cov"))

colonCancerWGBS <- read.bismark(files = covfiles, rmZeroCov = TRUE,
                                colData = targets)
In [3]:
Code
colonCancerWGBS <- readRDS("methyl_seq.rds")
In [4]:
Code
cov <- getCoverage(colonCancerWGBS,type = "Cov")
m <- getCoverage(colonCancerWGBS,type = "M")

# proportion of cpgs that have coverage in all samples

index=apply(cov>0,1,all)
mean(index)
[1] 0.7743644
In [5]:
Code
tot = rowSums(cov)

hist(tot)

Code
#there are some very large values

tot |> 
  log10() |> 
  hist()

Code
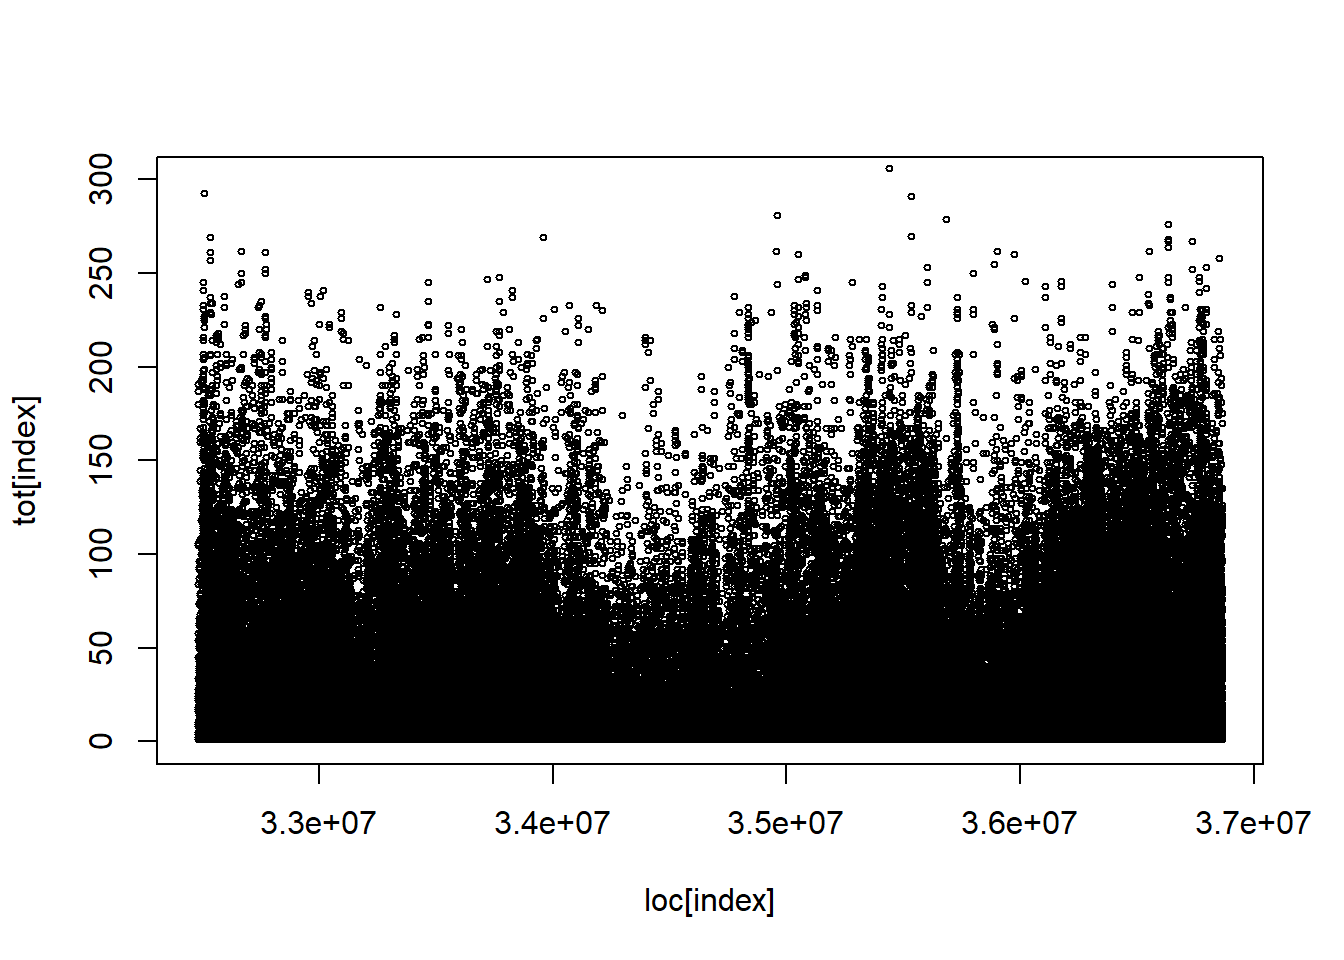
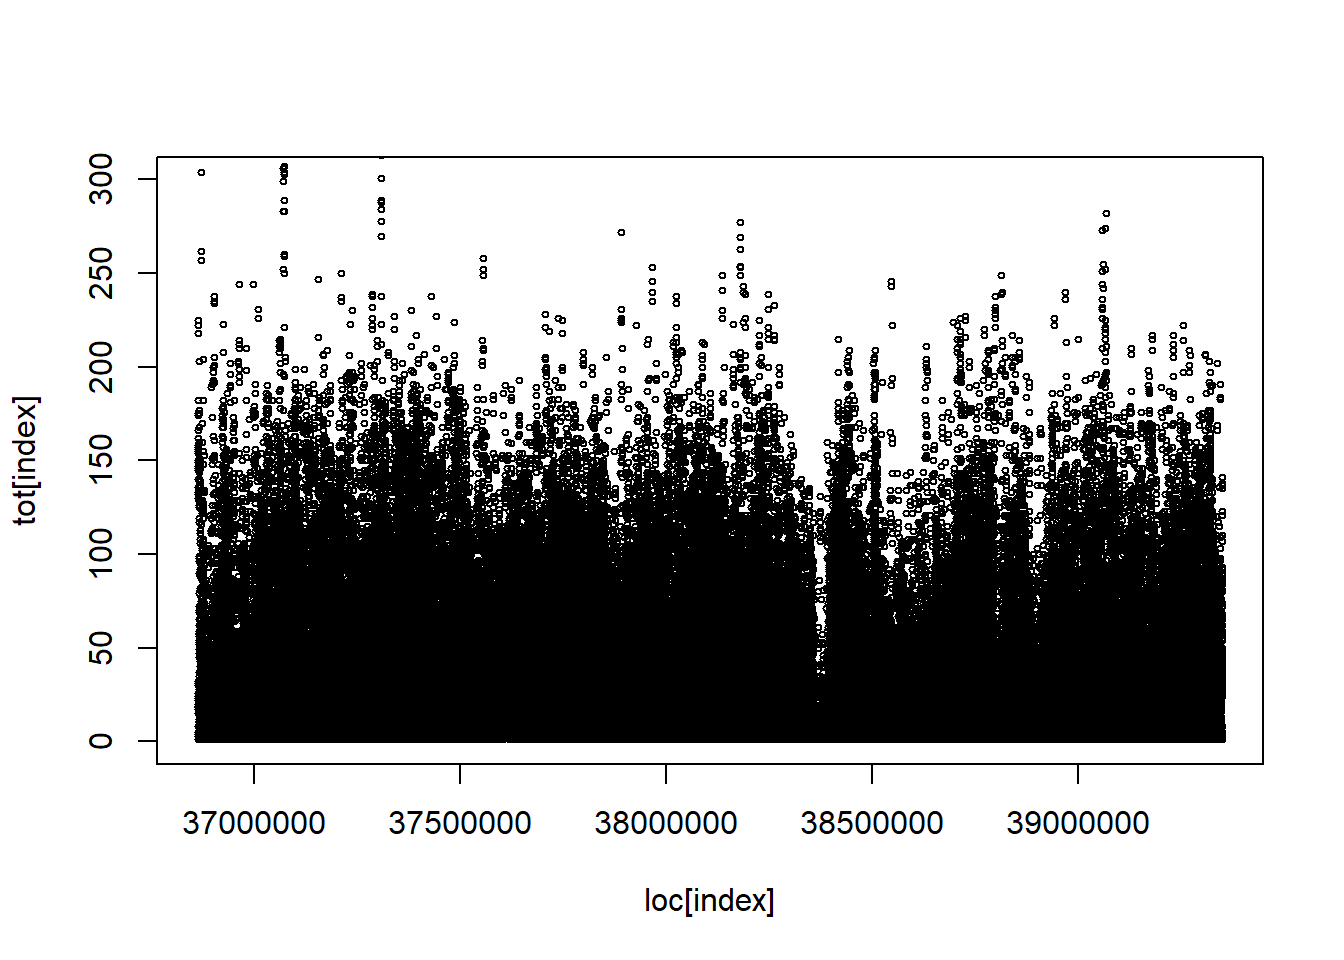
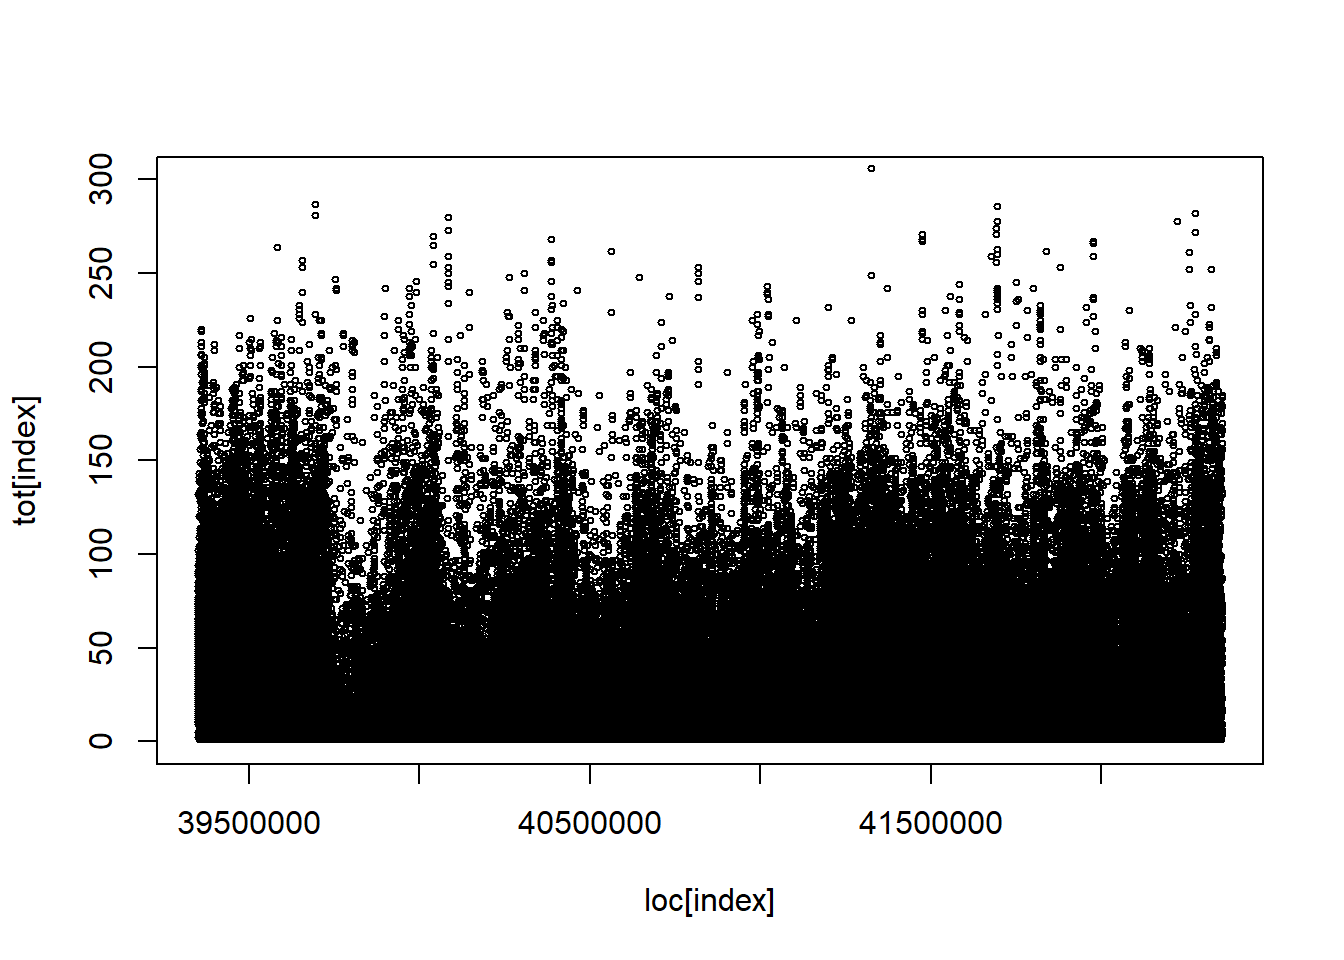
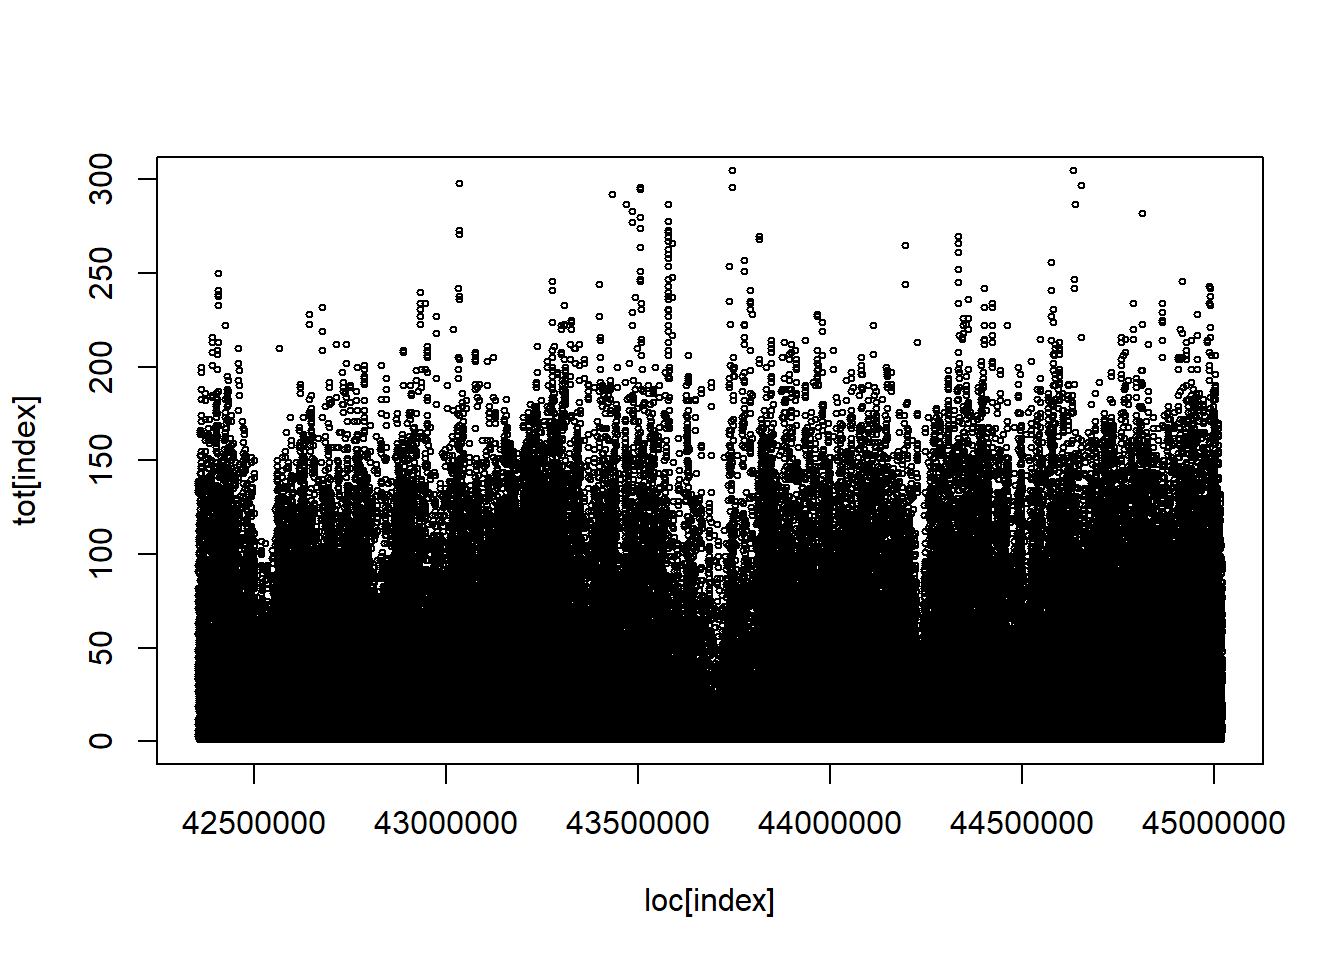
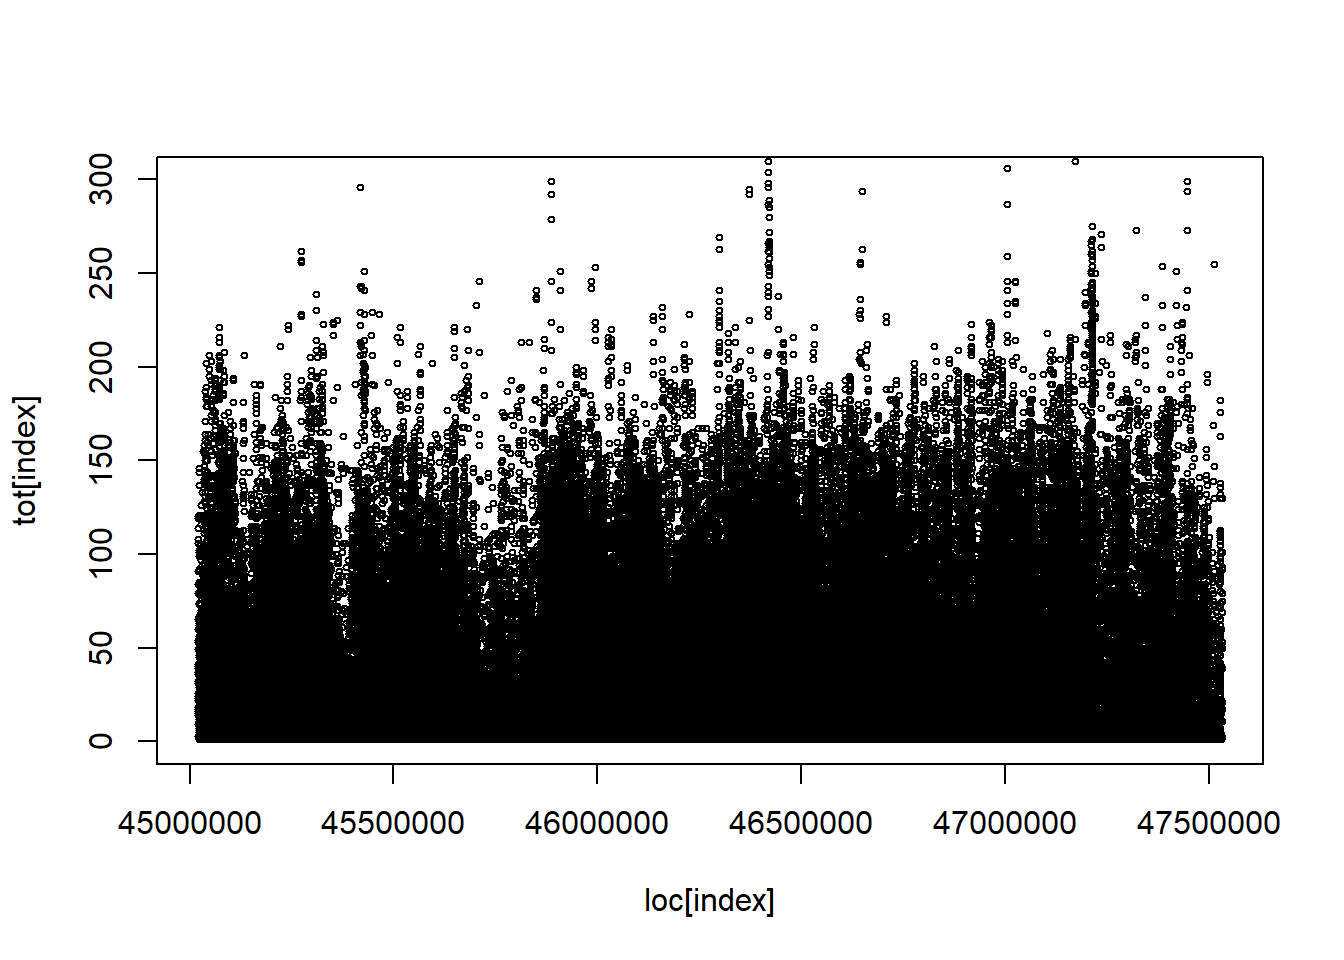
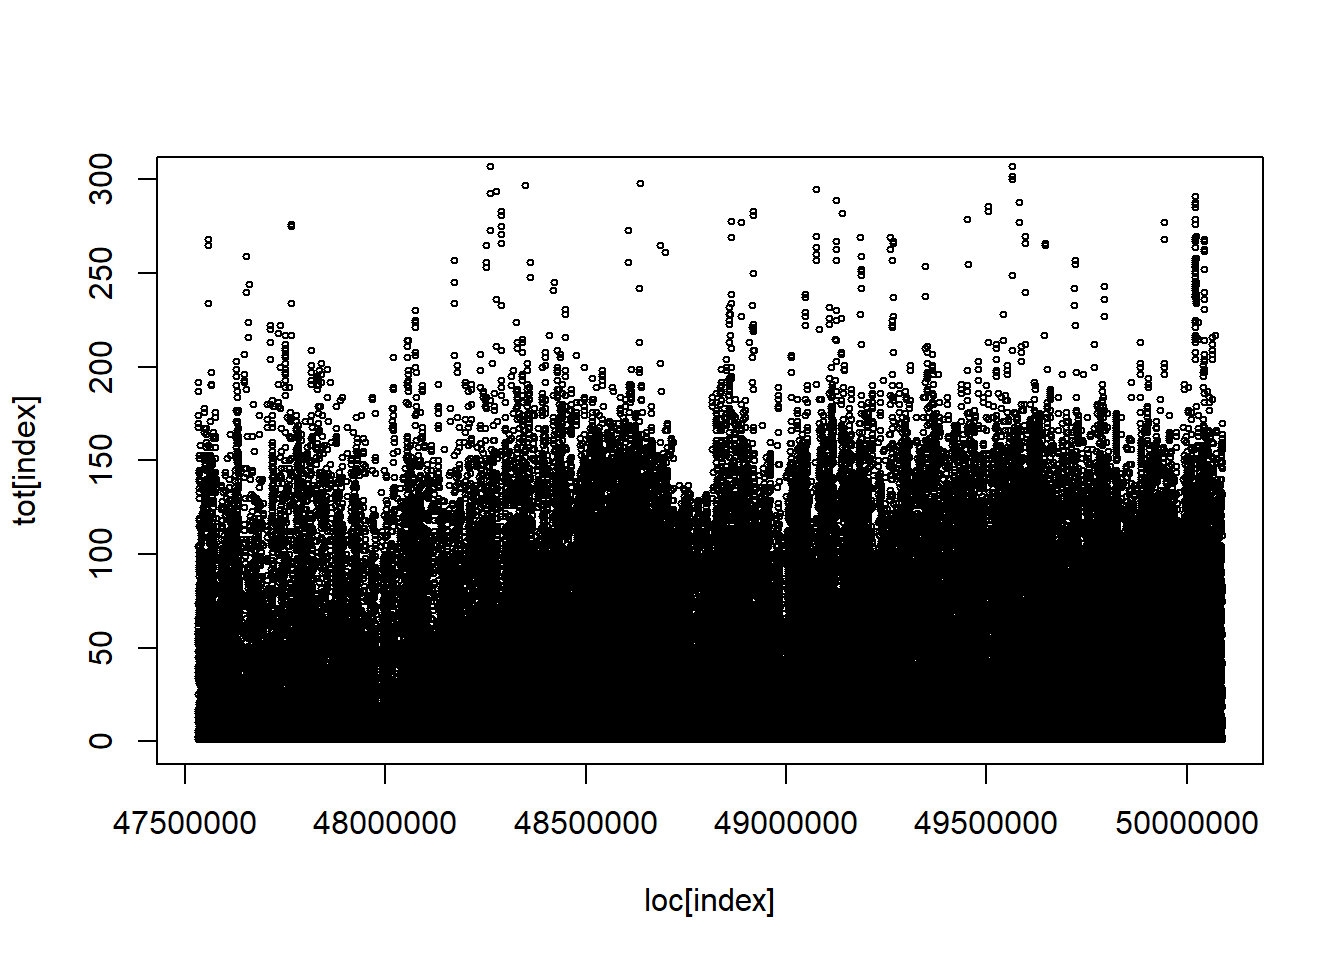
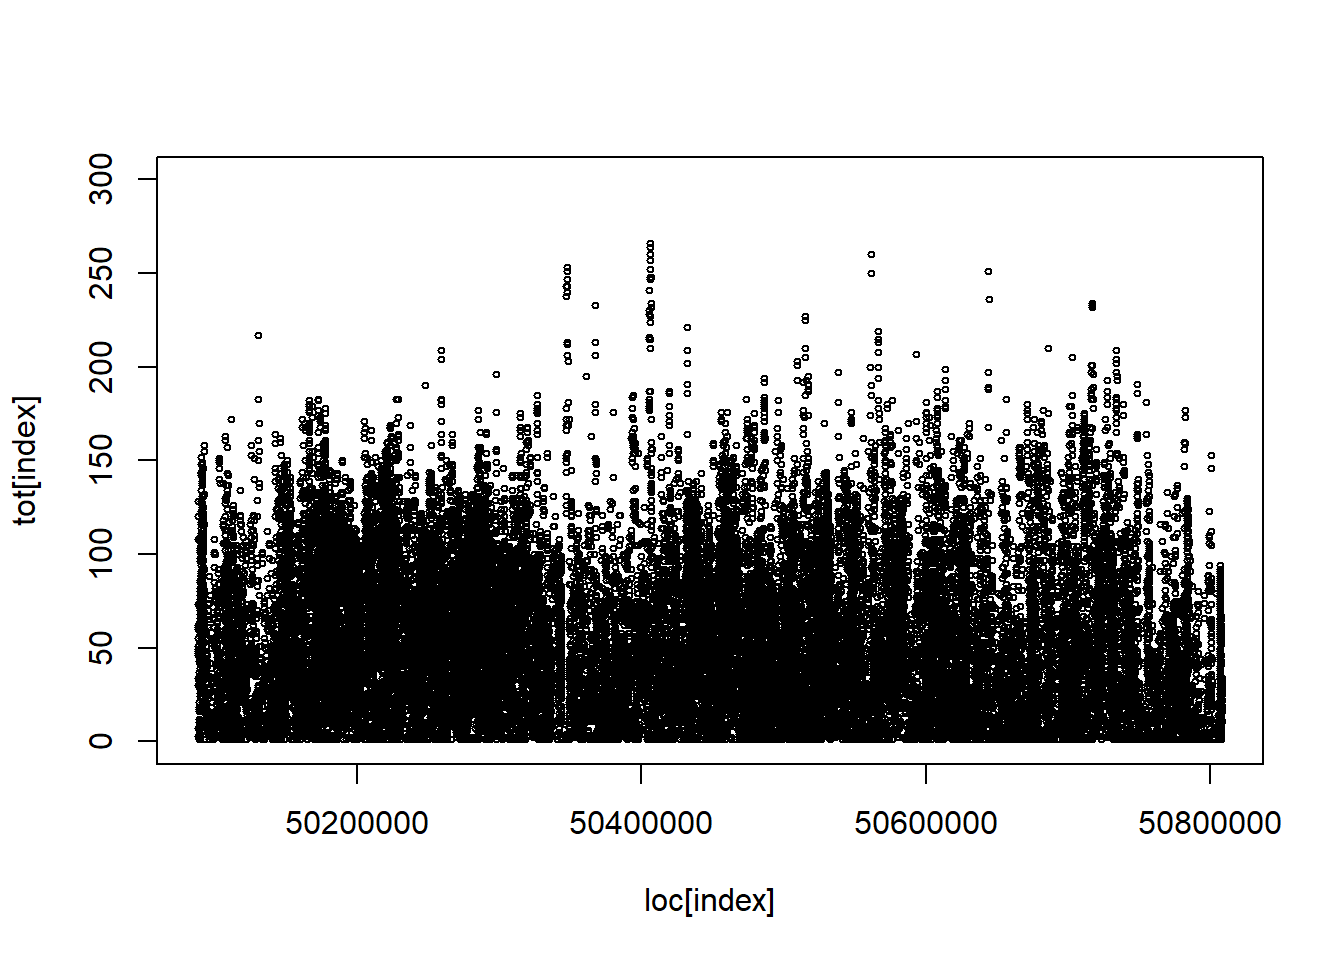
loc= start(colonCancerWGBS)

##plot the coverage by pieces

for(i in 1:11){
  index=1:100000+100000*i ##very ad-hoc
  plot(loc[index],tot[index],cex=.5,ylim=c(0,300))
}

In [6]:
Code
# Methylation status
meth_status <- m/cov
meth_status |> tail()
           SRR949210 SRR949211 SRR949212 SRR949213 SRR949214 SRR949215
[1140635,] 0.6666667         1      0.75 0.8571429 1.0000000 0.8888889
[1140636,] 0.3333333       NaN      0.60 0.8750000 1.0000000 0.8750000
[1140637,] 0.5000000       NaN      0.75 1.0000000 0.6666667 0.8571429
[1140638,] 0.5000000       NaN      0.50 0.7500000 0.3333333 0.7500000
[1140639,] 0.5000000       NaN      0.50 1.0000000 0.5000000 0.8333333
[1140640,] 0.5000000       NaN      1.00 0.0000000 0.0000000 1.0000000
Code
# Standard error of this estimate
1/sqrt(cov) |> 
  tail()
           SRR949210 SRR949211 SRR949212 SRR949213 SRR949214 SRR949215
[1140635,] 0.5773503         1 0.5000000 0.3779645 1.0000000 0.3333333
[1140636,] 0.5773503       Inf 0.4472136 0.3535534 0.7071068 0.3535534
[1140637,] 0.5000000       Inf 0.5000000 0.5000000 0.5773503 0.3779645
[1140638,] 0.5000000       Inf 0.5000000 0.5000000 0.5773503 0.5000000
[1140639,] 0.5000000       Inf 0.7071068 0.7071068 0.7071068 0.4082483
[1140640,] 0.7071068       Inf 0.7071068 1.0000000 1.0000000 0.4472136

Data Analysis

First we need to smooth the data:

In [7]:
Code
library(BiocParallel)
Warning: package 'BiocParallel' was built under R version 4.3.1
Code
bs_fit <- BSmooth(BSseq = colonCancerWGBS, BPPARAM = BiocParallel::MulticoreParam(workers = 8), verbose = T)
Warning in BiocParallel::MulticoreParam(workers = 8): MulticoreParam() not
supported on Windows, use SnowParam()
Warning in lfproc(x, y, weights = weights, cens = cens, base = base, geth =
geth, : procv: parameters out of bounds

Warning in lfproc(x, y, weights = weights, cens = cens, base = base, geth =
geth, : procv: parameters out of bounds

Warning in lfproc(x, y, weights = weights, cens = cens, base = base, geth =
geth, : procv: parameters out of bounds

Warning in lfproc(x, y, weights = weights, cens = cens, base = base, geth =
geth, : procv: parameters out of bounds

Warning in lfproc(x, y, weights = weights, cens = cens, base = base, geth =
geth, : procv: parameters out of bounds

Warning in lfproc(x, y, weights = weights, cens = cens, base = base, geth =
geth, : procv: parameters out of bounds

Warning in lfproc(x, y, weights = weights, cens = cens, base = base, geth =
geth, : procv: parameters out of bounds

Warning in lfproc(x, y, weights = weights, cens = cens, base = base, geth =
geth, : procv: parameters out of bounds

Warning in lfproc(x, y, weights = weights, cens = cens, base = base, geth =
geth, : procv: parameters out of bounds

Warning in lfproc(x, y, weights = weights, cens = cens, base = base, geth =
geth, : procv: parameters out of bounds

Warning in lfproc(x, y, weights = weights, cens = cens, base = base, geth =
geth, : procv: parameters out of bounds

Warning in lfproc(x, y, weights = weights, cens = cens, base = base, geth =
geth, : procv: parameters out of bounds
In [8]:
Code
# Average coverage of CpGs 
round(colMeans(getCoverage(bs_fit)), 1)
SRR949210 SRR949211 SRR949212 SRR949213 SRR949214 SRR949215 
      7.6       7.6       8.7       8.8       8.7       8.8 
Code
# Number of CpGs
length(bs_fit)
[1] 1140640
Code
## Number of CpGs which are covered by at least 1 read in all 6 samples
sum(rowSums(cov >= 1) == 6)
[1] 883271
Code
## Number of CpGs with 0 coverage in all samples
sum(rowSums(cov) == 0) 
[1] 0
Code
# this happens due to the rmZeroCov = TRUE parameter inside the function read.bismark()

Filtering loci

There isn’t a manual for this task.

In [9]:
Code
keep_loci <- which(rowSums(cov[, bs_fit$title == "Colon_Tumor_Primary"] >= 2) >= 2 &
                     rowSums(cov[, bs_fit$title == "Colon_Primary_Normal"] >= 2) >= 2)

keep_loci |> length()
[1] 891744
In [10]:
Code
bs_fit <- bs_fit[keep_loci,]
bs_fit
An object of type 'BSseq' with
  891744 methylation loci
  6 samples
has been smoothed with
  BSmooth (ns = 70, h = 1000, maxGap = 100000000) 
All assays are in-memory

Compute t-statistics

In [11]:
Code
bs_tstat <- BSmooth.tstat(BSseq = bs_fit, group1 = c("SRR949210","SRR949211","SRR949212"), group2 = c("SRR949213","SRR949214","SRR949215"), estimate.var = "group2", local.correct = T, verbose = T)
[BSmooth.tstat] preprocessing ... done in 0.5 sec
[BSmooth.tstat] computing stats within groups ... done in 0.6 sec
[BSmooth.tstat] computing stats across groups ... done in 1.4 sec
In [12]:
Code
plot(bs_tstat)

Finding DMR’s

In [13]:
Code
dmrs0 <- dmrFinder(bs_tstat, cutoff = c(-4.6, 4.6))
[dmrFinder] creating dmr data.frame
Code
dmrs <- subset(dmrs0, n >= 3 & abs(meanDiff) >= 0.1)
nrow(dmrs)
[1] 2658
In [14]:
Code

df <- pData(bs_fit)
df$col <- rep(c("red", "blue"), each=3)

pData(bs_fit) <- df

plotRegion(bs_fit, dmrs[1,], extend = 10000, addRegions = dmrs)

Other type of plots

In [15]:
Code
library(Gviz)
Warning: package 'Gviz' was built under R version 4.3.2
Loading required package: grid
Code
genome <- "hg19"

dmr <- dmrs[1,]
chrom <- paste0("chr",dmr$chr)
start <- dmr$start
end <- dmr$end

minbase <- start - 0.05 * (end - start)
maxbase <- end + 0.05 * (end - start)

pal <- c("#377EB8","#E41A1C")

iTrack <- IdeogramTrack(genome = genome, chromosome = chrom, name = chrom)
gTrack <- GenomeAxisTrack(col="black", cex=1, name = "", fontcolor="black")

rTrack <- UcscTrack(genome = genome, 
                    chromosome = chrom, 
                    track = "NCBI RefSeq",
                    from = 44.9e6,to = 45.2e6, 
                    trackType = "GeneRegionTrack",
                    rstarts = "exonStarts", 
                    rends = "exonEnds", 
                    gene = "name",
                    symbol = "name2", 
                    transcript = "name",
                    strand = "strand",
                    fill = "darkblue",
                    stacking = "squish", 
                    name = "RefSeq",
                    showId = TRUE, 
                    geneSymbol = TRUE)
Warning in .local(x, ...): 'track' parameter is deprecated now you go by the 'table' instead
                Use ucscTables(genome, track) to retrieve the list of tables for a track
Warning in .local(x, ...): 'track' parameter is deprecated now you go by the 'table' instead
                Use ucscTables(genome, track) to retrieve the list of tables for a track
Code
gr <- makeGRangesFromDataFrame(dmrs)

meth <- m/cov
index <- rownames(dmrs) |> as.numeric()
meth <- meth[index,]

seqlevelsStyle(gr) <- "UCSC"

index_1 <- which(targets$Run %in% c("SRR949210","SRR949211","SRR949212"))
index_2 <- which(targets$Run %in% c("SRR949213","SRR949214","SRR949215"))

targets$title[index_1] <- paste(targets$title[index_1],1:3, sep = ".")
targets$title[index_2] <- paste(targets$title[index_2],1:3, sep = ".")

a <- meth |> 
    as.data.frame()

names(a) <- targets$title
# index <- order(targets$Status)
# a <- a[,index]

a <- a |> dplyr::mutate_all(function(x){
    ifelse(is.nan(x),0,x)
})

for(i in 1:length(targets$title)){
    
    n <- colnames(a)[i]
    mcols(gr)[,n] <- a[,i]
    
}

# gr$beta <- getBeta(dat$object)

# mcols(gr) <- mcols(gr)[,4:37]

methTrack <- DataTrack(range = gr,
                       genome = genome,
                       chromosome = chrom, 
                       ylim = c(-0.05, 1.05),
                       col = pal,
                       type = c("a","p"), 
                       name = "DNA Meth.\n(beta value)",
                       background.panel = "white", 
                       legend = TRUE, 
                       cex.title = 0.8,
                       cex.axis = 0.8, 
                       cex.legend = 0.8)

dmrTrack <- AnnotationTrack(start = start, 
                            end = end, 
                            genome = genome, 
                            name = "DMR - Multi-resolution",
                            chromosom = chrom)

tracks <- list(iTrack, gTrack, methTrack, dmrTrack, rTrack)
sizes <- c(2, 2, 5, 2, 3) # set up the relative sizes of the tracks
In [16]:
Code
png(file="track_methyl_seq_plot.png", width = 1200, height = 550)

plotTracks(list(iTrack,gTrack, methTrack, dmrTrack, rTrack),add53=T, add35=T,grid=T,sizes=sizes,groups = rep(c("Colon_Tumor_Primary","Colon_Primary_Normal"), each=3),from = 44.9e6,to = 45.2e6)

dev.off()
png 
  2